Office Space
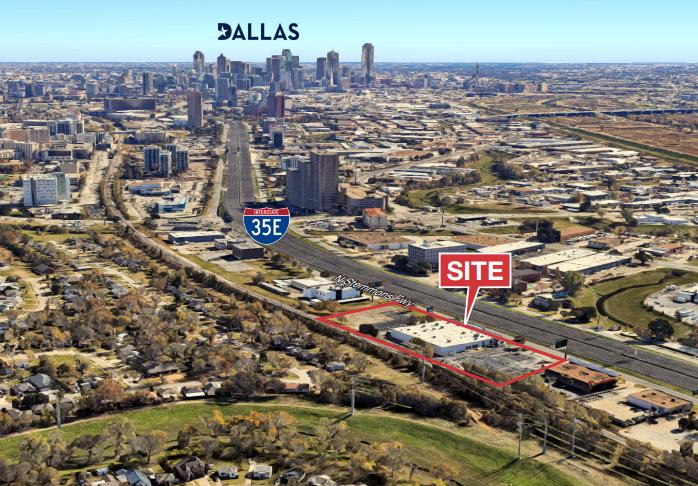
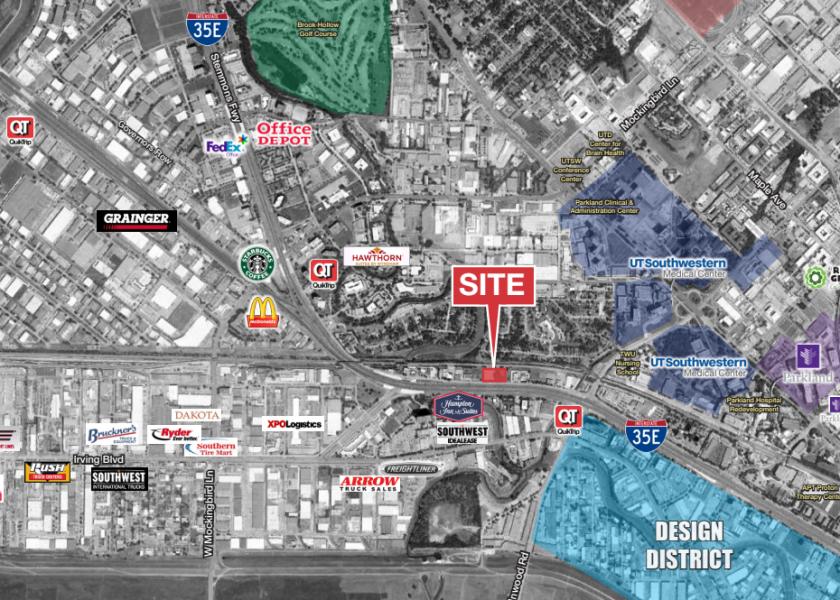
2998 - 3010 N Stemmons Fwy Dallas, TX 75247
2998 - 3010 N Stemmons Fwy Dallas, TX 75247
Details & Description
Property Highlights
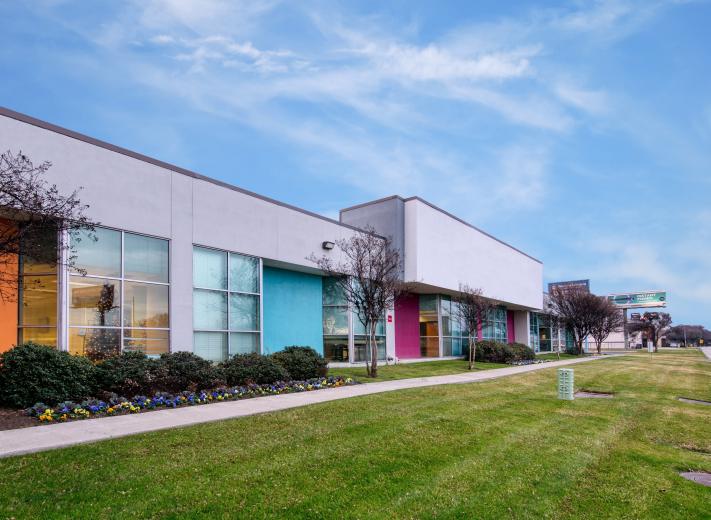
- • Office/Showroom/Warehouse
- • Signage Available
- • Abundant Parking
- • Situated on 3.91 Acres
- • Dallas Love Field-Calculated 11 Minutes
- • DFW Airport-Calculated 21 Minutes
Listing Agents

Chase Miller
O: 214-256-7131
M: 214-770-5495
cmiller@nairl.com
O: 214-256-7131
M: 214-770-5495
cmiller@nairl.com

Everett James
O: 214-256-7170
M: 214-904-9166
ejames@nairl.com
O: 214-256-7170
M: 214-904-9166
ejames@nairl.com
Robert Blankinship
O: 214-256-7115
M: 214-500-6326
rblankinship@nairl.com
O: 214-256-7115
M: 214-500-6326
rblankinship@nairl.com
While we strive to provide the most accurate information, all listing information, and demographic data, is provided by third-parties. As such, MyEListing will not be responsible for the accuracy of the information. It is strongly recommended that you verify all information with the listing agent, and any relevant agencies, prior to making any decisions.