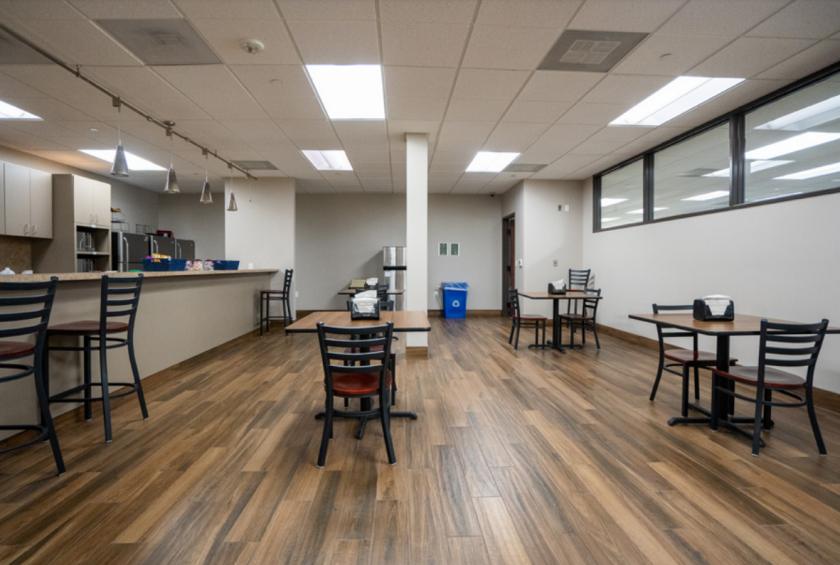
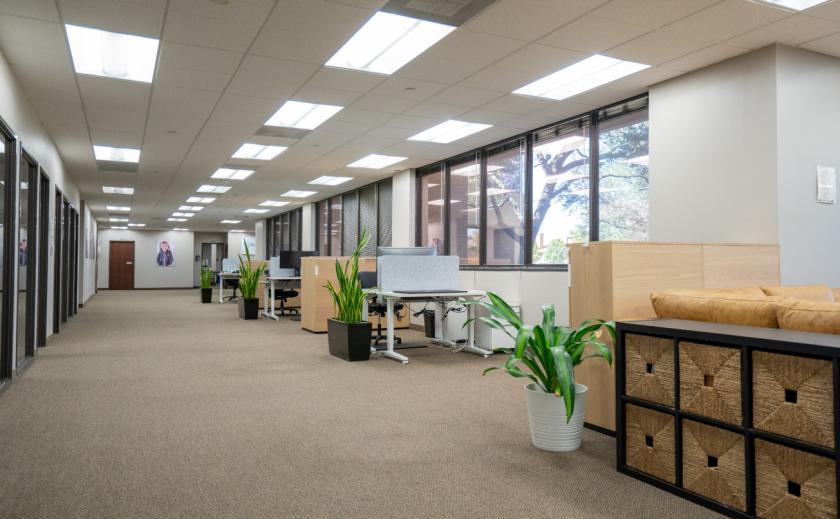
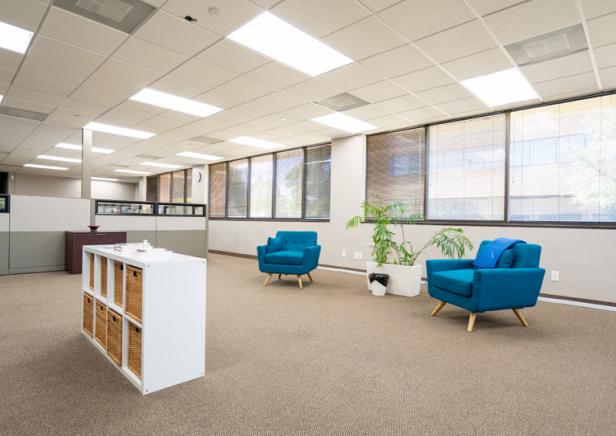
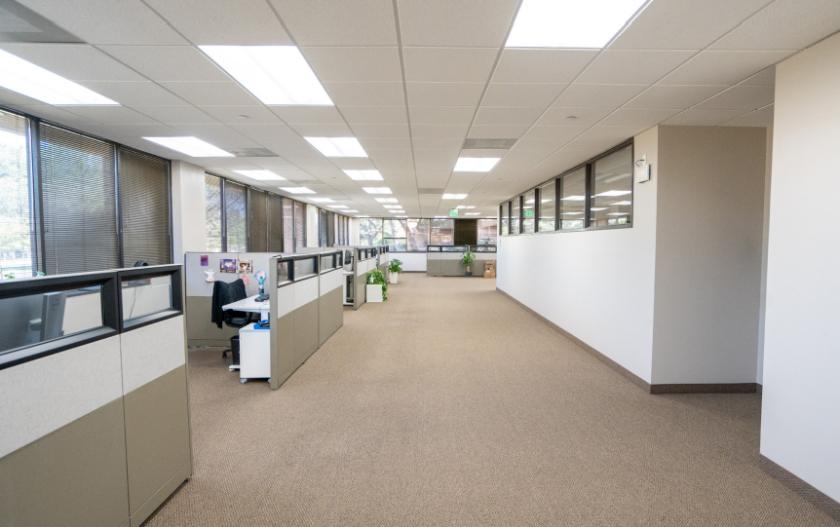
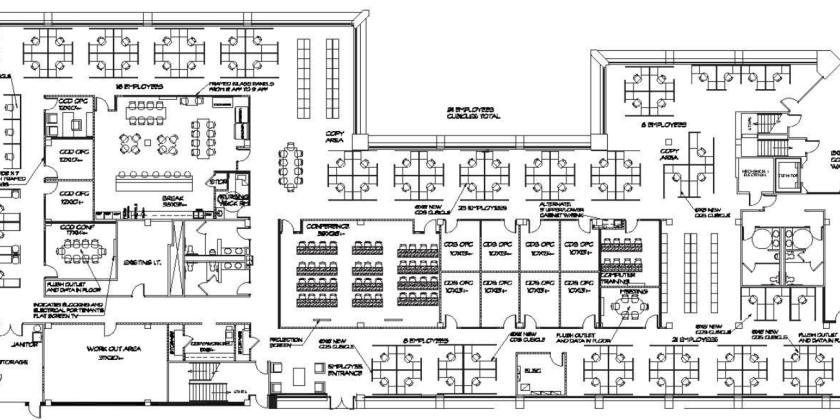
Office Space
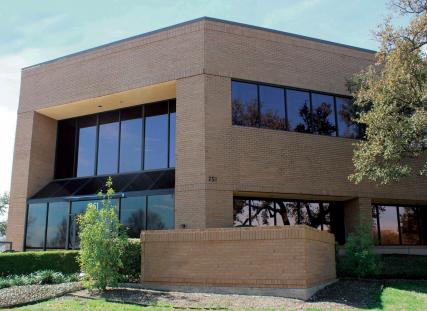
251 Renner Parkway Richardson, TX 75080
251 Renner Parkway Richardson, TX 75080
Details & Description
Property Highlights
- • Year Built: 1983
- • Number of Floors: TWO
- • Parking: 10/1,000 Existing & Expandable
- • Percent Leased: Current owner will vacate
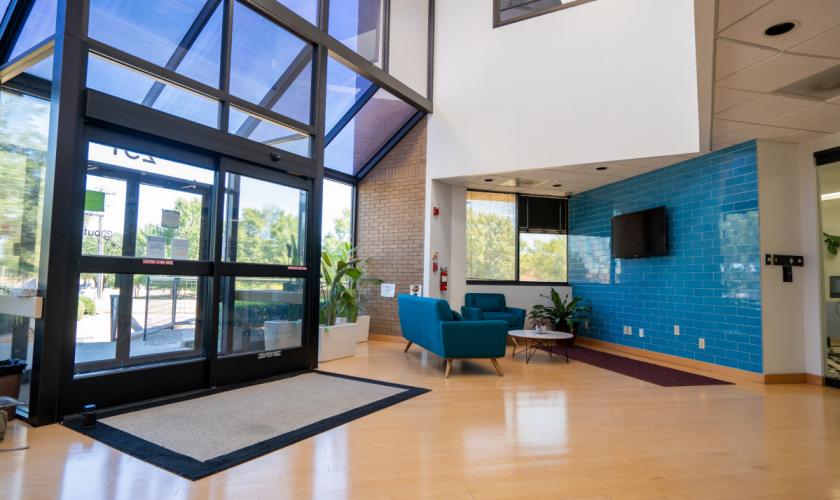
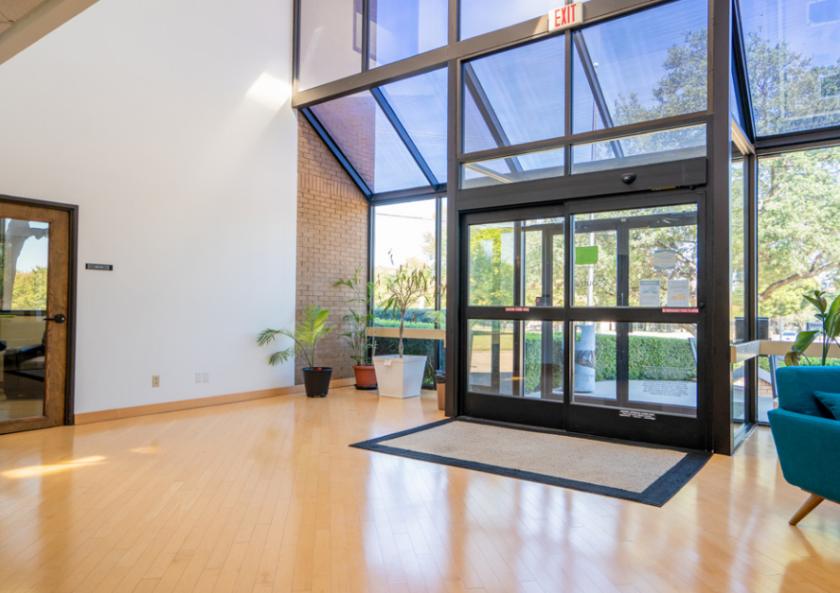
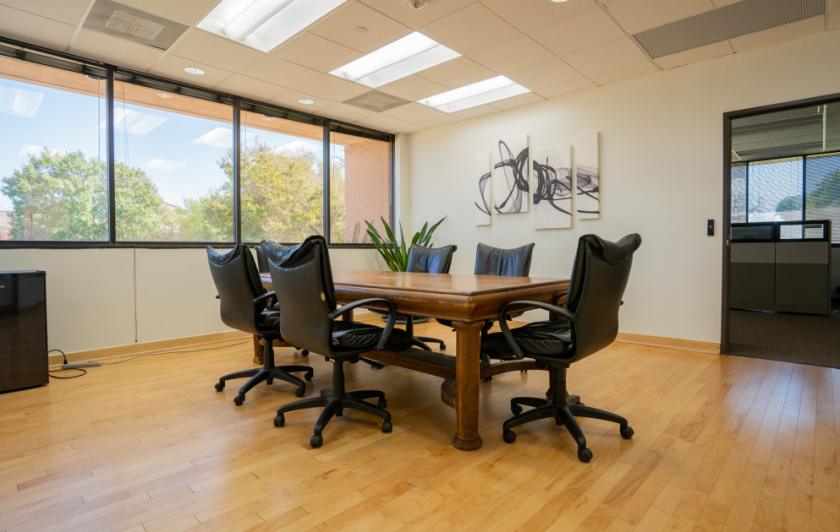
Additional Photos

Listing Agents

Stephen Cooper
O: 214-256-7160
M: 214-497-0730
scooper@nairl.com
O: 214-256-7160
M: 214-497-0730
scooper@nairl.com

Kent Smith
O: 214-256-7102
M: 972-529-8499
ksmith@nairl.com
O: 214-256-7102
M: 972-529-8499
ksmith@nairl.com
While we strive to provide the most accurate information, all listing information, and demographic data, is provided by third-parties. As such, MyEListing will not be responsible for the accuracy of the information. It is strongly recommended that you verify all information with the listing agent, and any relevant agencies, prior to making any decisions.