Office Space
3333 Welborn Street Dallas, TX 75219
3333 Welborn Street Dallas, TX 75219

Details & Description
Property Highlights
- • Suite 400
- • Building Class: B
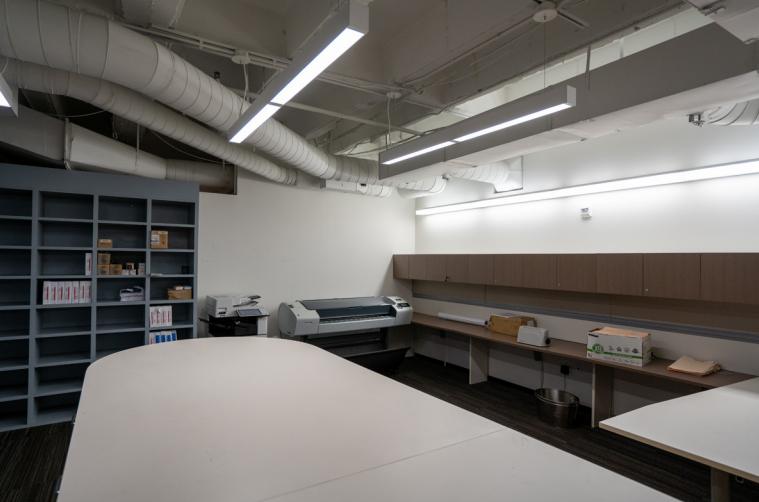
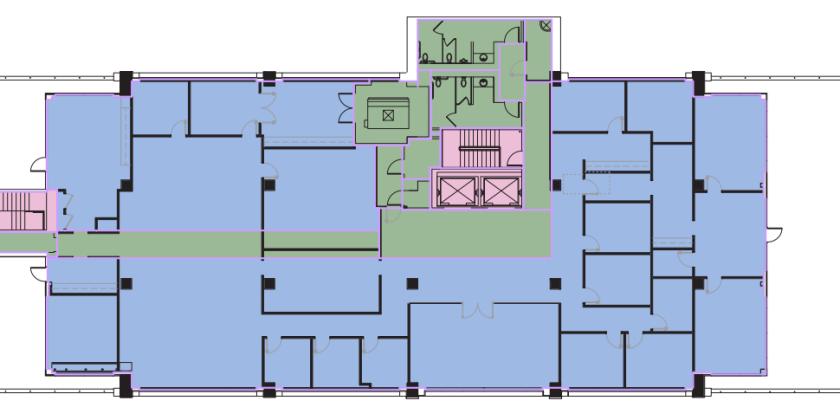
- • Unique Full Floor Opportunity
- • Private Balconies
- • Private Restroom
- • Furniture Included
Additional Photos


Listing Agents

Jeremy Brubaker
O: 214-256-7118
M: 469-274-3700
jbrubaker@nairl.com
O: 214-256-7118
M: 469-274-3700
jbrubaker@nairl.com

Lexis Norton
O: 214-256-7108
lnorton@nairl.com
O: 214-256-7108
lnorton@nairl.com
While we strive to provide the most accurate information, all listing information, and demographic data, is provided by third-parties. As such, MyEListing will not be responsible for the accuracy of the information. It is strongly recommended that you verify all information with the listing agent, and any relevant agencies, prior to making any decisions.