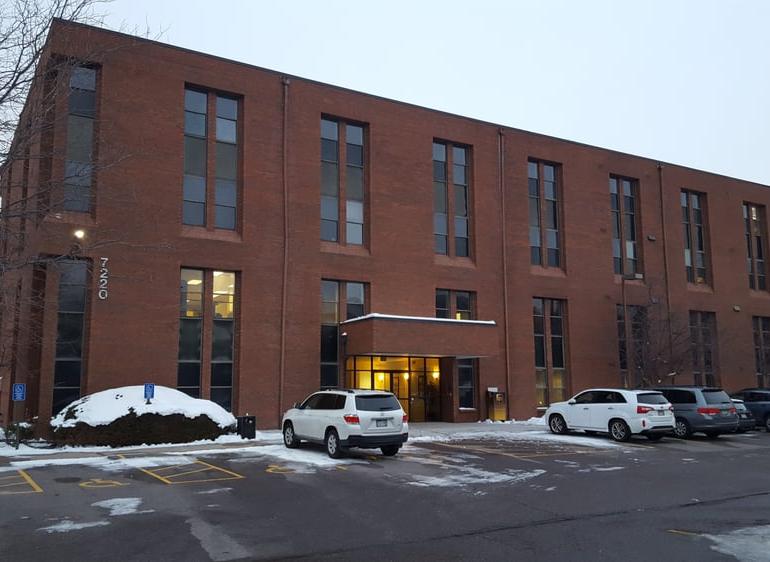
1-Mile | 3-Miles | 5-Miles | ||
---|---|---|---|---|
Total Population | 10,872 | 115,946 | 335,187 | |
Population Median Age | 41 | 40 | 39 | |
Population by Age | 0-9 Yrs | 996 (9%) | 12906 (11%) | 39614 (11%) |
10-19 Yrs | 832 (7%) | 11882 (10%) | 38736 (11%) | |
20-29 Yrs | 2520 (23%) | 17322 (14%) | 48389 (14%) | |
30-39 Yrs | 1586 (14%) | 17742 (15%) | 52782 (15%) | |
40-49 Yrs | 834 (7%) | 12921 (11%) | 42055 (12%) | |
50-59 Yrs | 1408 (12%) | 15421 (13%) | 42150 (12%) | |
60-69 Yrs | 1033 (9%) | 13140 (11%) | 37198 (11%) | |
70+ Yrs | 1663 (15%) | 14613 (12%) | 34262 (10%) | |
Median HH Income | $55,586 | $73,325 | $74,792 | |
Total Household Income | < 24K | 867 (16%) | 5534 (12%) | 17714 (14%) |
25-49K | 1447 (28%) | 8246 (18%) | 22980 (18%) | |
50-74K | 1053 (20%) | 8933 (20%) | 22424 (17%) | |
75-99K | 693 (13%) | 6275 (14%) | 18352 (14%) | |
100-199K | 849 (16%) | 11970 (27%) | 35091 (27%) | |
200K+ | 246 (4%) | 3198 (7%) | 9307 (7%) | |
Highest Education Level | No Diploma | 644 | 8009 | 25306 |
Diploma or GED | 1949 | 18982 | 55704 | |
Some College | 1841 | 17775 | 47794 | |
Assoc. Degree | 635 | 6498 | 17326 | |
Bachelors Degree | 2161 | 22364 | 61021 | |
Higher Degree | 1058 | 10741 | 29788 | |
Total Housing Units | 5,498 | 45,807 | 130,541 | |
--Owner-Occupied | 2,699 | 29,715 | 82,348 | |
--Renter-Occupied | 2,457 | 14,441 | 43,520 | |
Owner-Occupied Values | < 100K | 187 | 939 | 2019 |
100-199K | 490 | 1941 | 4865 | |
200-299K | 672 | 5673 | 14732 | |
300-399K | 396 | 8446 | 24665 | |
400-499K | 324 | 6607 | 19696 | |
500K+ | 629 | 6109 | 16371 | |
Total Working Age Population | 9,425 | 96,073 | 272,236 | |
In Work Force | 6,114 | 62,597 | 184,395 | |
Not In Work Force | 3,311 | 33,477 | 87,840 | |
Workforce Employed | 6,000 | 60,177 | 177,890 | |
Workforce Unemployed | 111 | 2,378 | 6,417 | |
Civlian Workforce | 6,110 | 62,555 | 184,307 | |
Military Workforce | 3 | 41 | 88 | |
Total Households | 5,155 | 44,156 | 125,868 | |
Family Households | 2,215 | 26,489 | 78,686 | |
Non-Family Households | 2,940 | 17,667 | 47,182 | |
Married Couple | 1,516 | 19,914 | 58,400 | |
Other Family | 699 | 6,575 | 20,286 | |
Married w/Child | 369 | 7,209 | 22,640 | |
Single Male w/Child | 72 | 875 | 2,890 | |
Single Female w/Child | 313 | 2,283 | 6,775 |
Population Change Last Two Decades - Plus Projection
2000 | % | 2010 | % | 2020 | % | 2030 | |
---|---|---|---|---|---|---|---|
Colorado | 4,301,261 | +17 | 5,029,196 | +16 | 5,838,181 | +15 | 6,733,658 |
Denver County | 554,636 | +8 | 600,158 | +23 | 738,611 | +12 | 827,681 |
Jefferson County | 527,056 | +1 | 534,543 | +10 | 587,118 | +7 | 626,742 |
Arapahoe County | 487,967 | +17 | 572,003 | +16 | 662,304 | +13 | 750,773 |
Total Working Age Population:
Total Households:
Total Working Age Population:
Total Households:
Total Working Age Population:
Total Households: