Office Space
1290 Shermer Road Northbrook, IL 60062
1290 Shermer Road Northbrook, IL 60062

Details & Description
Property Highlights
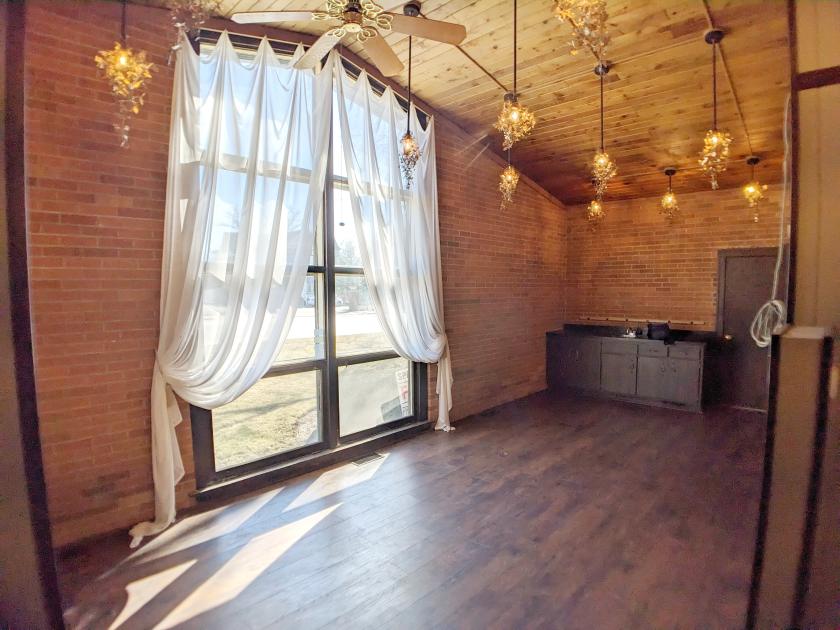
• Suite 2 – 606 SF. Tall plate-glass windows providing ample natural light, 2 offices, insuite restroom, separate d
• Suite 4 – 700 SF. Formerly a dental suite. 2 operatories with water, 2 private offices, reception, kitchenette /
Listing Agents

Patrice Marks
KW Commercial
O: 847-409-7983
M: 312-471-6450
patrice@kwcommercial.com
KW Commercial
O: 847-409-7983
M: 312-471-6450
patrice@kwcommercial.com
While we strive to provide the most accurate information, all listing information, and demographic data, is provided by third-parties. As such, MyEListing will not be responsible for the accuracy of the information. It is strongly recommended that you verify all information with the listing agent, and any relevant agencies, prior to making any decisions.