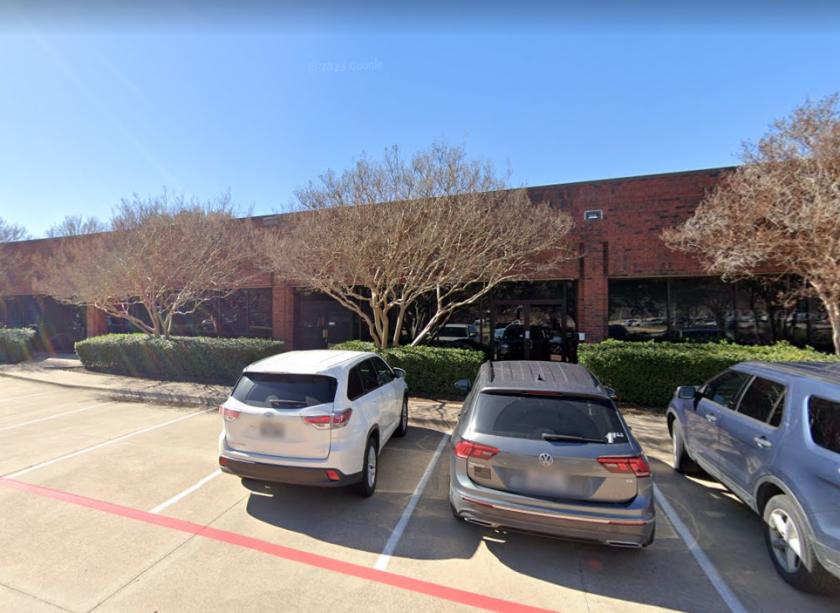
1-Mile | 3-Miles | 5-Miles | ||
---|---|---|---|---|
Total Population | 3,487 | 72,866 | 182,259 | |
Population Median Age | 28 | 32 | 34 | |
Population by Age | 0-9 Yrs | 884 (25%) | 13061 (17%) | 28414 (15%) |
10-19 Yrs | 347 (9%) | 6624 (9%) | 20436 (11%) | |
20-29 Yrs | 407 (11%) | 13024 (17%) | 30846 (16%) | |
30-39 Yrs | 890 (25%) | 16863 (23%) | 35717 (19%) | |
40-49 Yrs | 612 (17%) | 9751 (13%) | 26377 (14%) | |
50-59 Yrs | 135 (3%) | 6710 (9%) | 20239 (11%) | |
60-69 Yrs | 130 (3%) | 3970 (5%) | 11809 (6%) | |
70+ Yrs | 81 (2%) | 2863 (3%) | 8421 (4%) | |
Median HH Income | $109,796 | $75,444 | $74,928 | |
Total Household Income | < 24K | 61 (5%) | 3166 (10%) | 7748 (10%) |
25-49K | 95 (8%) | 5162 (17%) | 13989 (19%) | |
50-74K | 112 (9%) | 6476 (21%) | 14057 (19%) | |
75-99K | 191 (16%) | 5263 (17%) | 11099 (15%) | |
100-199K | 517 (44%) | 7196 (24%) | 17995 (25%) | |
200K+ | 179 (15%) | 2532 (8%) | 6621 (9%) | |
Highest Education Level | No Diploma | 52 | 3192 | 13935 |
Diploma or GED | 98 | 6943 | 19116 | |
Some College | 214 | 7386 | 19357 | |
Assoc. Degree | 38 | 3307 | 7652 | |
Bachelors Degree | 797 | 16230 | 37015 | |
Higher Degree | 986 | 12361 | 24746 | |
Total Housing Units | 1,286 | 32,893 | 77,371 | |
--Owner-Occupied | 444 | 6,886 | 24,297 | |
--Renter-Occupied | 710 | 22,908 | 47,212 | |
Owner-Occupied Values | < 100K | 8 | 252 | 1593 |
100-199K | 3 | 794 | 6417 | |
200-299K | 25 | 1346 | 4715 | |
300-399K | 34 | 1237 | 4460 | |
400-499K | 77 | 1529 | 3816 | |
500K+ | 298 | 1727 | 3296 | |
Total Working Age Population | 2,329 | 55,663 | 140,835 | |
In Work Force | 1,684 | 42,421 | 106,968 | |
Not In Work Force | 645 | 13,242 | 33,867 | |
Workforce Employed | 1,641 | 40,751 | 102,695 | |
Workforce Unemployed | 41 | 1,495 | 4,062 | |
Civlian Workforce | 1,682 | 42,246 | 106,757 | |
Military Workforce | 2 | 175 | 211 | |
Total Households | 1,154 | 29,794 | 71,508 | |
Family Households | 976 | 18,436 | 45,015 | |
Non-Family Households | 179 | 11,358 | 26,493 | |
Married Couple | 859 | 14,029 | 33,691 | |
Other Family | 117 | 4,407 | 11,324 | |
Married w/Child | 633 | 7,106 | 17,177 | |
Single Male w/Child | 49 | 703 | 1,417 | |
Single Female w/Child | 20 | 1,789 | 4,450 |
Population Change Last Two Decades - Plus Projection
2000 | % | 2010 | % | 2020 | % | 2030 | |
---|---|---|---|---|---|---|---|
Texas | 20,851,820 | +21 | 25,145,561 | +18 | 29,677,668 | +18 | 34,894,452 |
Tarrant County | 1,446,219 | +25 | 1,809,034 | +19 | 2,143,755 | +17 | 2,507,170 |
Dallas County | 2,218,899 | +7 | 2,368,139 | +15 | 2,734,111 | +14 | 3,106,298 |
Total Working Age Population:
Total Households:
Total Working Age Population:
Total Households:
Total Working Age Population:
Total Households: