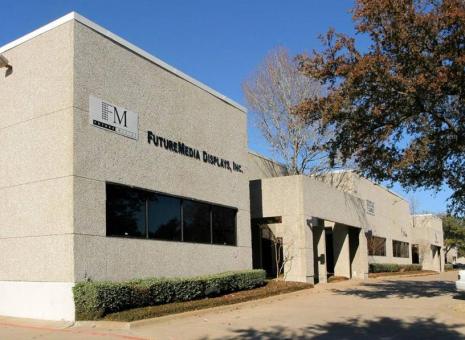
Flex-Office-Warehouse
2120 Hutton Drive Carrollton, TX 75006
2120 Hutton Drive Carrollton, TX 75006
Details & Description
Property Highlights
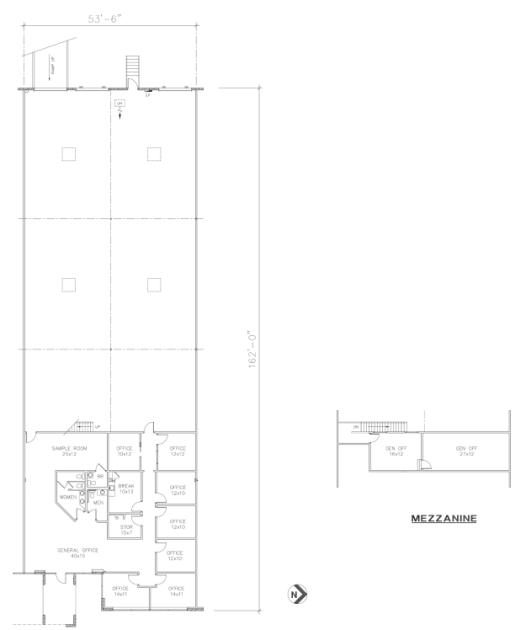
- • Suite 700
- • 2,089 SF Office
- • 21’ Clear Height
- • Air-Conditioned Office
- • Two (2) Dock High Doors
- • 1 Ramped Door
Listing Agents

John Lancaster
O: 214-256-7162
M: 214-244-3217
jlancaster@robertlynn.com
O: 214-256-7162
M: 214-244-3217
jlancaster@robertlynn.com
While we strive to provide the most accurate information, all listing information, and demographic data, is provided by third-parties. As such, MyEListing will not be responsible for the accuracy of the information. It is strongly recommended that you verify all information with the listing agent, and any relevant agencies, prior to making any decisions.