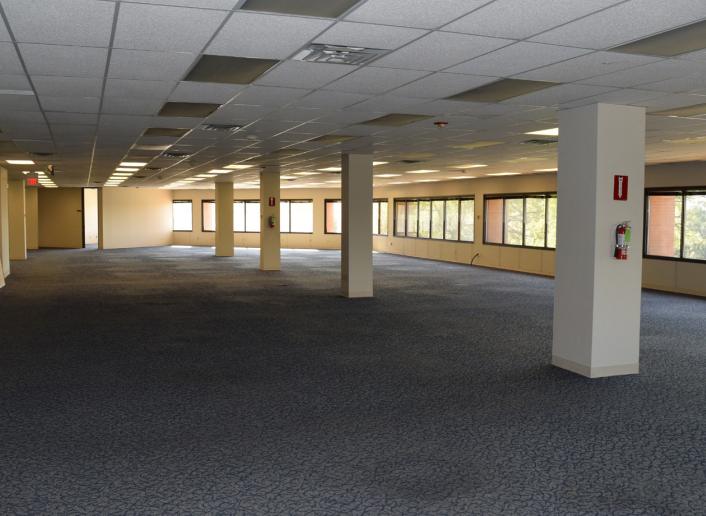
Office Space
1400 Corporate Drive Irving, TX 75038
1400 Corporate Drive Irving, TX 75038
Details & Description
Property Highlights
- • Building Class: B
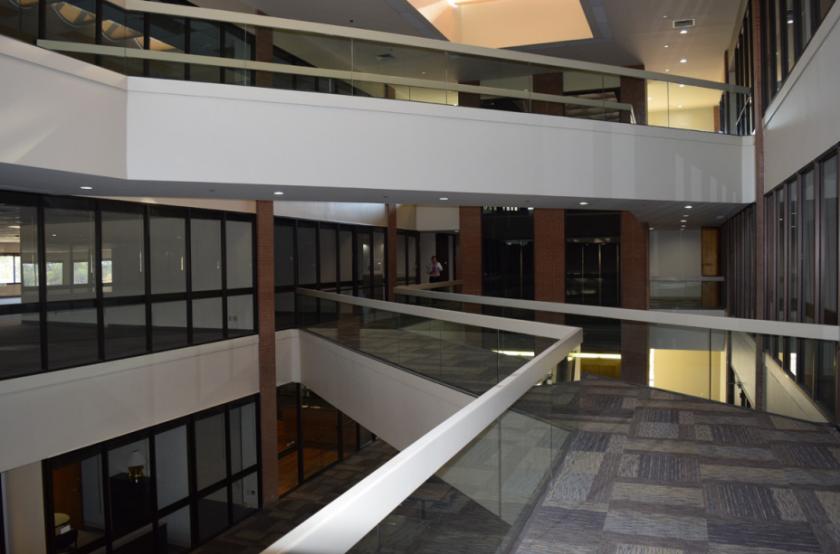
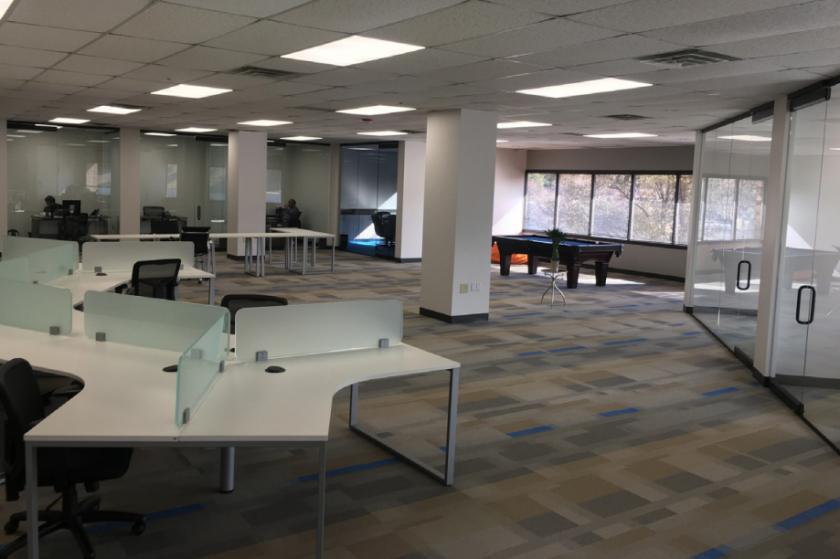
- • Floor-to-Ceiling Glass Window Atrium Suites
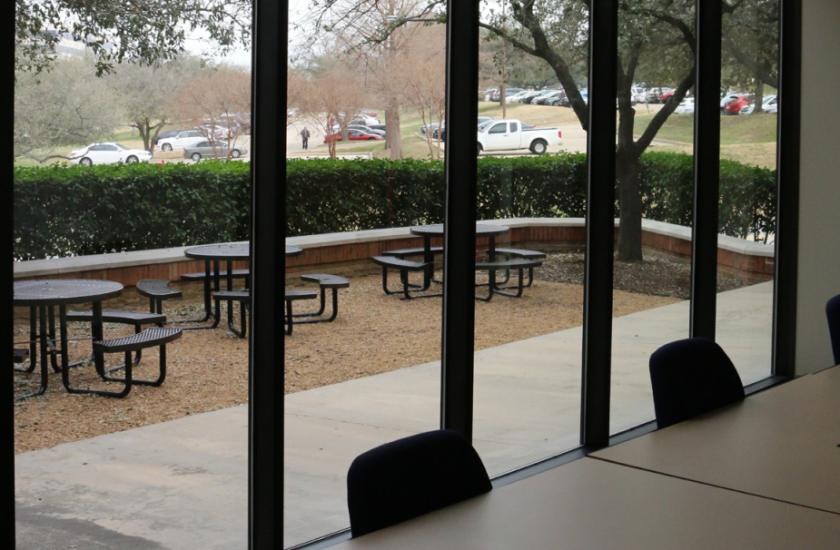
- • Parking Ratio: 4.55/1,000 SF (Surface)
- • Building Conference Center
- • Meticulously Maintainted Building
- • 5 Miles from DFW Airport
Additional Photos

Listing Agents

James Davis
O: 214-256-7103
M: 214-435-3382
jdavis@nairl.com
O: 214-256-7103
M: 214-435-3382
jdavis@nairl.com

Everett James
O: 214-256-7170
M: 214-904-9166
ejames@nairl.com
O: 214-256-7170
M: 214-904-9166
ejames@nairl.com

Grant Frerichs
O: 214-256-7146
M: 214-601-0722
gfrerichs@nairl.com
O: 214-256-7146
M: 214-601-0722
gfrerichs@nairl.com
While we strive to provide the most accurate information, all listing information, and demographic data, is provided by third-parties. As such, MyEListing will not be responsible for the accuracy of the information. It is strongly recommended that you verify all information with the listing agent, and any relevant agencies, prior to making any decisions.


