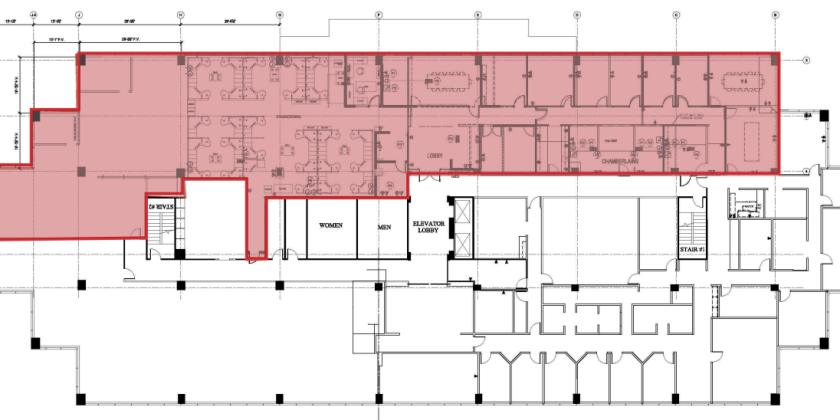
Office Space
15280 Addison Road Addison, TX 75001
15280 Addison Road Addison, TX 75001

Details & Description
Property Highlights
- • Occupancy: Immediate
- • Rate: $18.00/SF + E
- • Term: Through May 14, 2024
- • Located in the Heart of Addison
- • Premier Ingress/Egress to Dallas North Tollway
- • Walking Distance to Retail and Restaurants
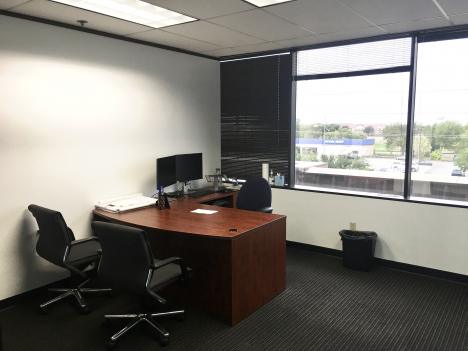
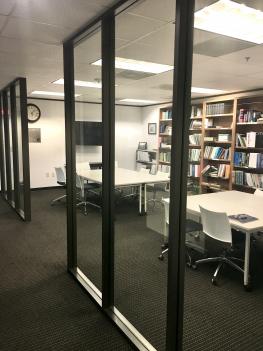
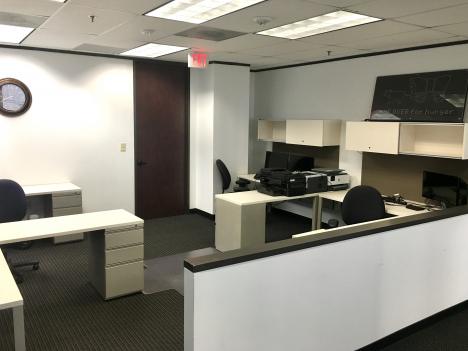
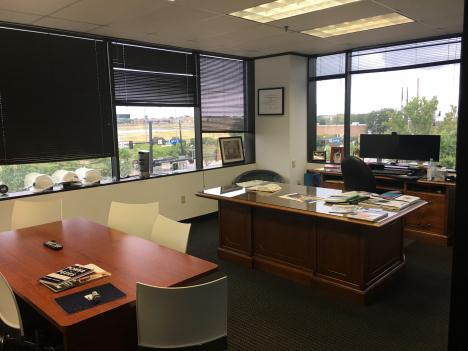
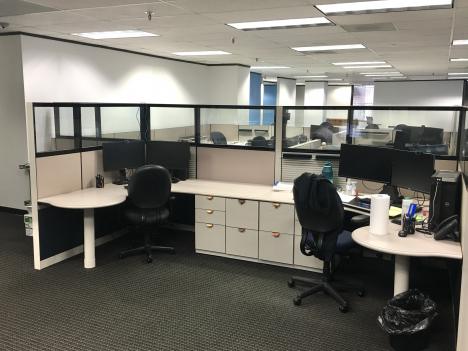
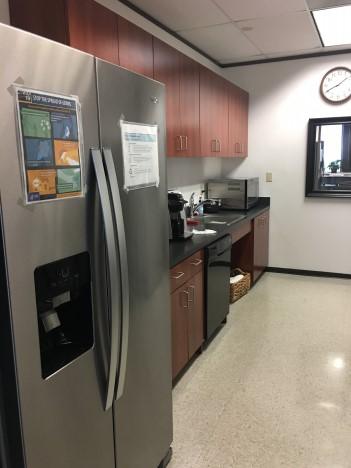
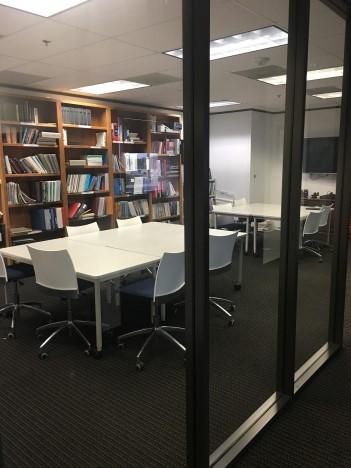
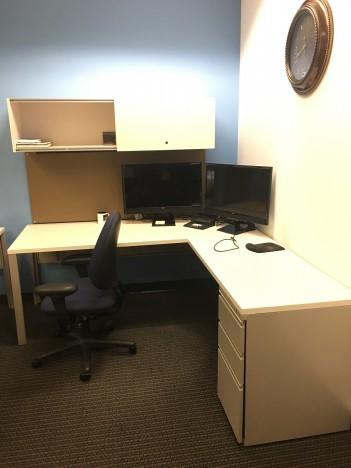
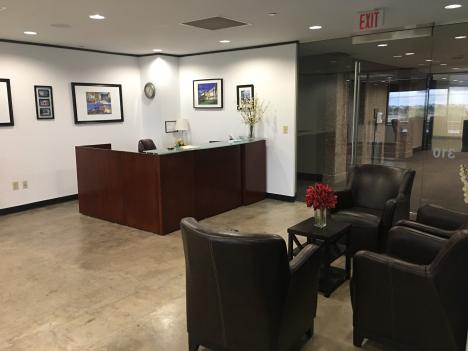
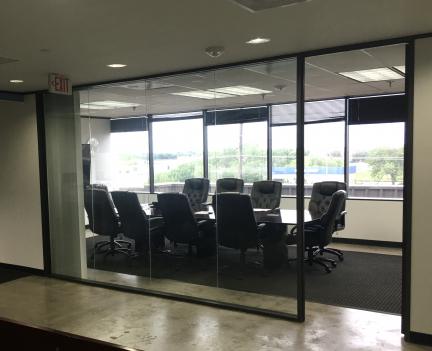
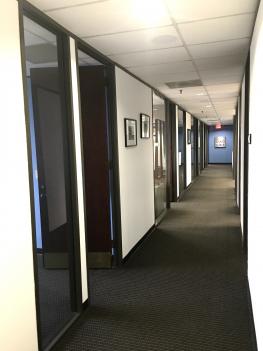
Additional Photos

Listing Agents

Nick Lee
O: 214-256-7121
M: 214-927-0487
nlee@nairl.com
O: 214-256-7121
M: 214-927-0487
nlee@nairl.com

Jayson Montoya
O: 214-256-7136
M: 214-926-7347
jmontoya@nairl.com
O: 214-256-7136
M: 214-926-7347
jmontoya@nairl.com
While we strive to provide the most accurate information, all listing information, and demographic data, is provided by third-parties. As such, MyEListing will not be responsible for the accuracy of the information. It is strongly recommended that you verify all information with the listing agent, and any relevant agencies, prior to making any decisions.