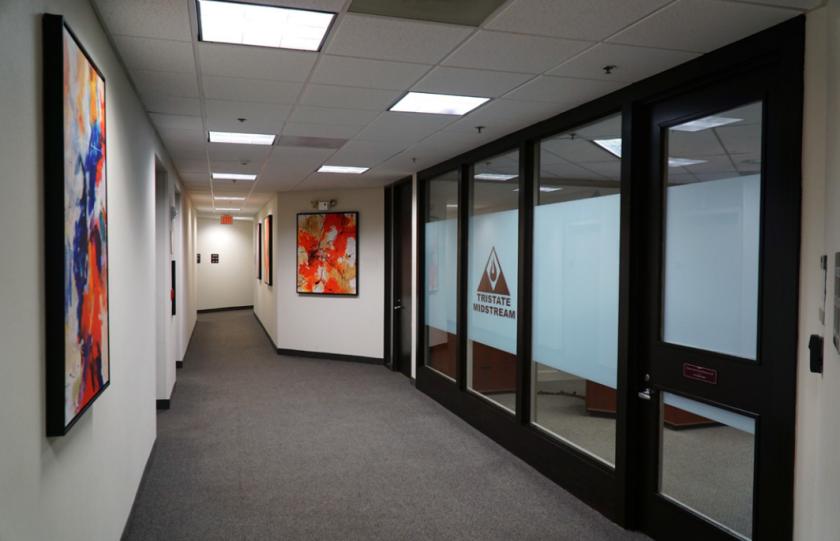
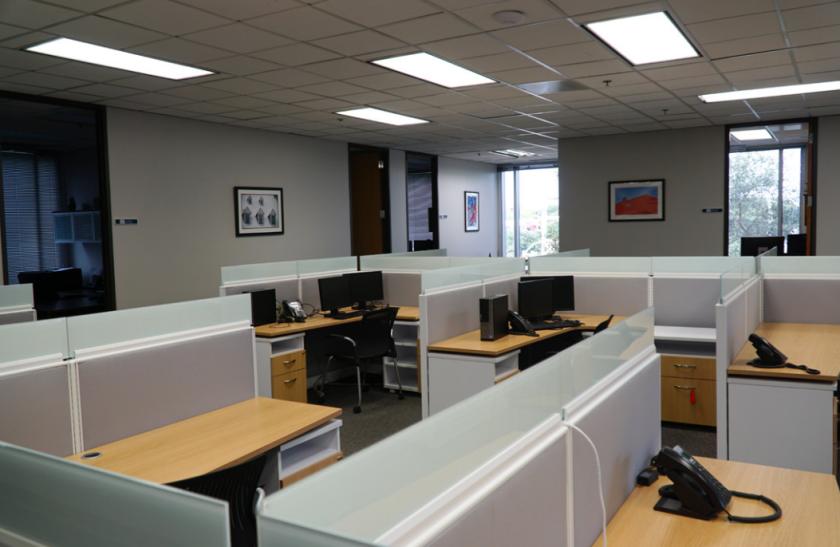
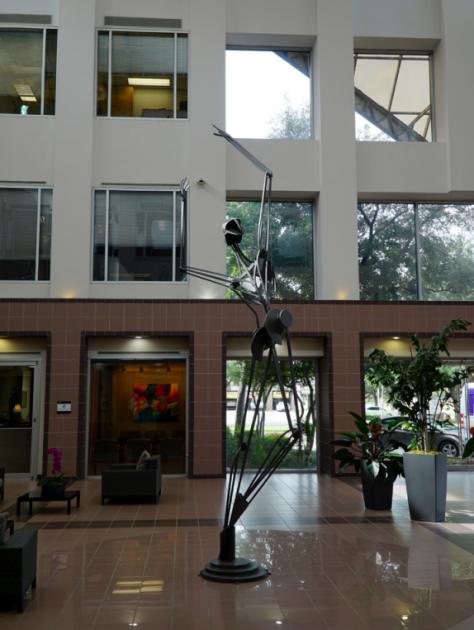
Office Space
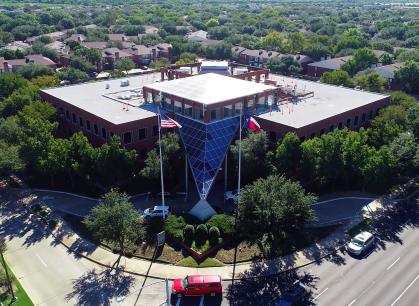
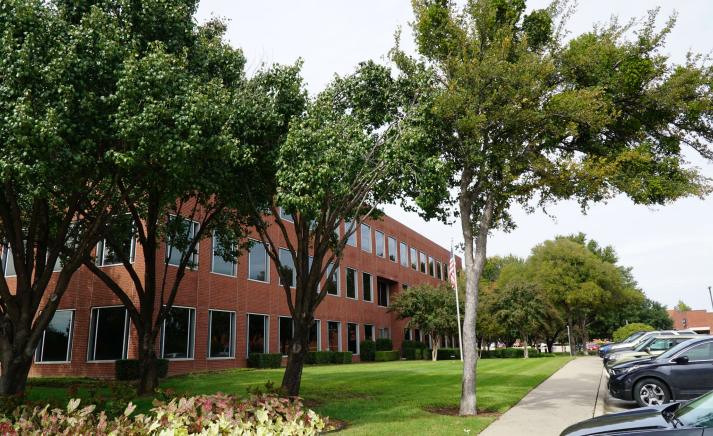
9901 Valley Ranch Parkway East Irving, TX 75063
9901 Valley Ranch Parkway East Irving, TX 75063
Details & Description
Property Highlights
- • Recently completed renovations
- • Parking Ratio: 3.21/1,000 SF
- • Easy commute to the DFW International Airport
- • Retail and Quality Residential Neighborhoods
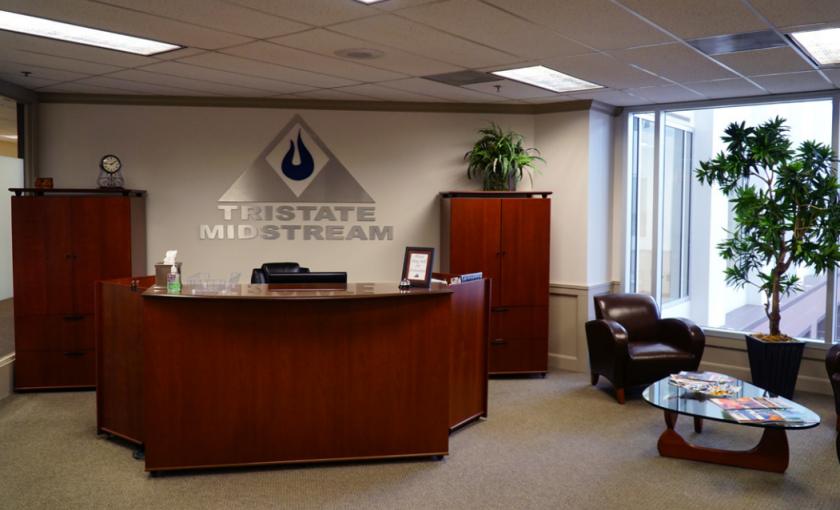
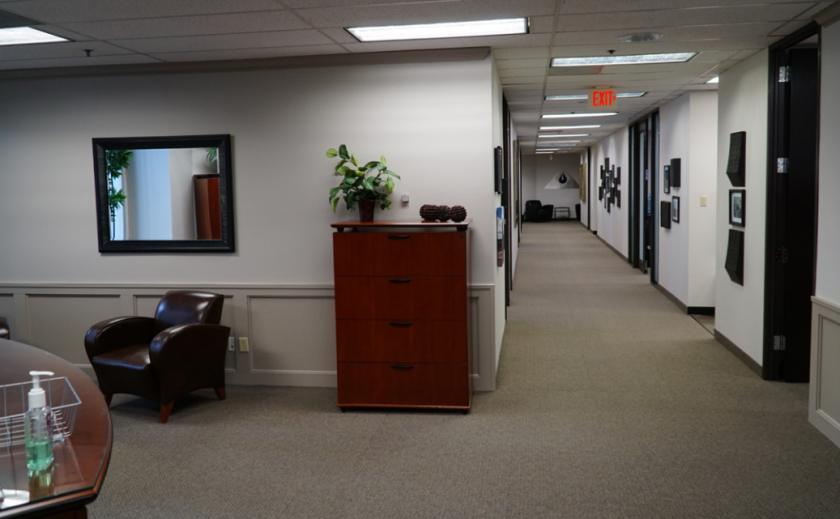
Additional Photos
Listing Agents

James Davis
O: 214-256-7103
M: 214-435-3382
jdavis@nairl.com
O: 214-256-7103
M: 214-435-3382
jdavis@nairl.com

Everett James
O: 214-256-7170
M: 214-904-9166
ejames@nairl.com
O: 214-256-7170
M: 214-904-9166
ejames@nairl.com

Grant Frerichs
O: 214-256-7146
M: 214-601-0722
gfrerichs@nairl.com
O: 214-256-7146
M: 214-601-0722
gfrerichs@nairl.com
While we strive to provide the most accurate information, all listing information, and demographic data, is provided by third-parties. As such, MyEListing will not be responsible for the accuracy of the information. It is strongly recommended that you verify all information with the listing agent, and any relevant agencies, prior to making any decisions.