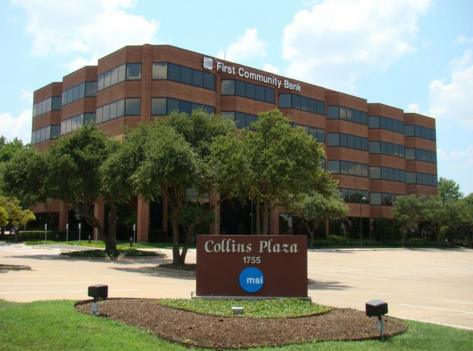
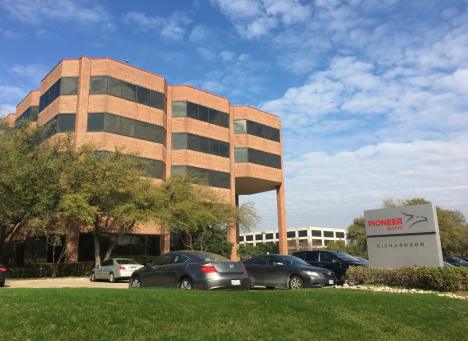
1-Mile | 3-Miles | 5-Miles | ||
---|---|---|---|---|
Total Population | 10,679 | 111,293 | 381,681 | |
Population Median Age | 38 | 38 | 37 | |
Population by Age | 0-9 Yrs | 1760 (16%) | 13754 (12%) | 51243 (13%) |
10-19 Yrs | 1251 (11%) | 13240 (11%) | 46877 (12%) | |
20-29 Yrs | 1329 (12%) | 19275 (17%) | 62399 (16%) | |
30-39 Yrs | 1515 (14%) | 16340 (14%) | 58235 (15%) | |
40-49 Yrs | 1171 (10%) | 11514 (10%) | 47927 (12%) | |
50-59 Yrs | 1072 (10%) | 12907 (11%) | 45658 (11%) | |
60-69 Yrs | 957 (8%) | 11331 (10%) | 35561 (9%) | |
70+ Yrs | 1624 (15%) | 12933 (11%) | 33781 (8%) | |
Median HH Income | $77,070 | $76,864 | $66,761 | |
Total Household Income | < 24K | 436 (10%) | 5823 (13%) | 22962 (15%) |
25-49K | 685 (16%) | 7839 (18%) | 30965 (21%) | |
50-74K | 923 (22%) | 7653 (17%) | 26220 (18%) | |
75-99K | 394 (9%) | 5477 (12%) | 18168 (12%) | |
100-199K | 997 (24%) | 12315 (28%) | 33257 (23%) | |
200K+ | 718 (17%) | 4340 (9%) | 12491 (8%) | |
Highest Education Level | No Diploma | 435 | 5596 | 32738 |
Diploma or GED | 747 | 9423 | 41462 | |
Some College | 1261 | 14583 | 52052 | |
Assoc. Degree | 639 | 5687 | 17954 | |
Bachelors Degree | 2465 | 24040 | 69343 | |
Higher Degree | 1554 | 15113 | 39786 | |
Total Housing Units | 4,475 | 46,943 | 156,505 | |
--Owner-Occupied | 2,530 | 23,238 | 69,086 | |
--Renter-Occupied | 1,624 | 20,207 | 74,977 | |
Owner-Occupied Values | < 100K | 138 | 653 | 3323 |
100-199K | 495 | 4486 | 16711 | |
200-299K | 411 | 7716 | 19884 | |
300-399K | 359 | 5923 | 14766 | |
400-499K | 367 | 2412 | 7322 | |
500K+ | 760 | 2048 | 7080 | |
Total Working Age Population | 8,165 | 90,280 | 302,539 | |
In Work Force | 5,339 | 60,395 | 211,753 | |
Not In Work Force | 2,825 | 29,886 | 90,786 | |
Workforce Employed | 5,080 | 57,570 | 201,290 | |
Workforce Unemployed | 257 | 2,759 | 10,378 | |
Civlian Workforce | 5,337 | 60,329 | 211,668 | |
Military Workforce | 3 | 66 | 85 | |
Total Households | 4,154 | 43,445 | 144,063 | |
Family Households | 2,646 | 26,847 | 90,864 | |
Non-Family Households | 1,508 | 16,598 | 53,199 | |
Married Couple | 1,828 | 20,139 | 64,430 | |
Other Family | 818 | 6,708 | 26,434 | |
Married w/Child | 731 | 8,114 | 28,168 | |
Single Male w/Child | 187 | 752 | 3,764 | |
Single Female w/Child | 392 | 2,654 | 9,918 |
Population Change Last Two Decades - Plus Projection
2000 | % | 2010 | % | 2020 | % | 2030 | |
---|---|---|---|---|---|---|---|
Texas | 20,851,820 | +21 | 25,145,561 | +18 | 29,677,668 | +18 | 34,894,452 |
Collin County | 491,675 | +59 | 782,341 | +33 | 1,039,369 | +34 | 1,391,461 |
Dallas County | 2,218,899 | +7 | 2,368,139 | +15 | 2,734,111 | +14 | 3,106,298 |
Total Working Age Population:
Total Households:
Total Working Age Population:
Total Households:
Total Working Age Population:
Total Households: