Office Space
4004 Belt Line Road Addison, TX 75001
4004 Belt Line Road Addison, TX 75001
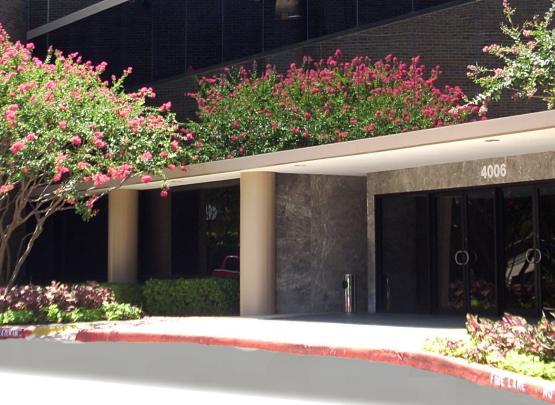
Details & Description
Property Highlights
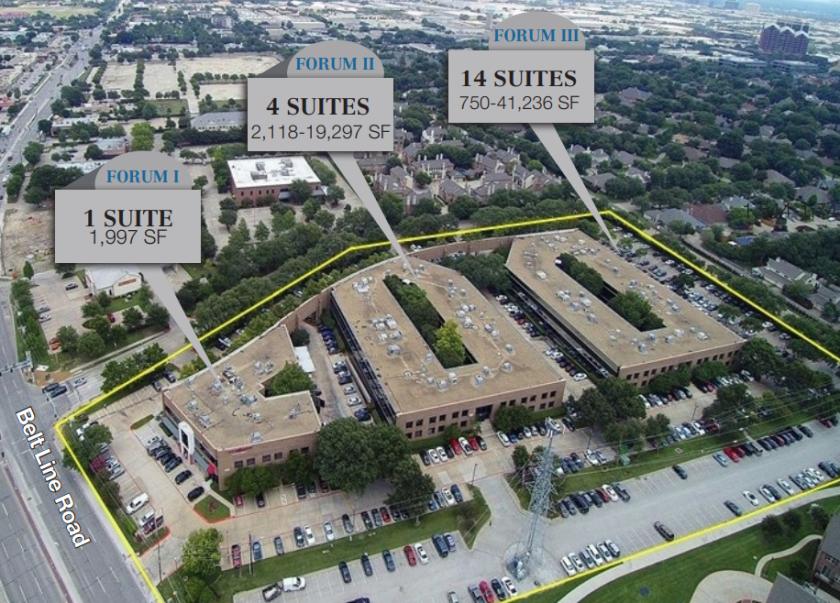
• Close Proximity to Dallas North Tollway, I-635 and President George Bush Turnpike
• Excellent Mix of Office Space and Highly- Trafficked Retail/Restaurant Spaces
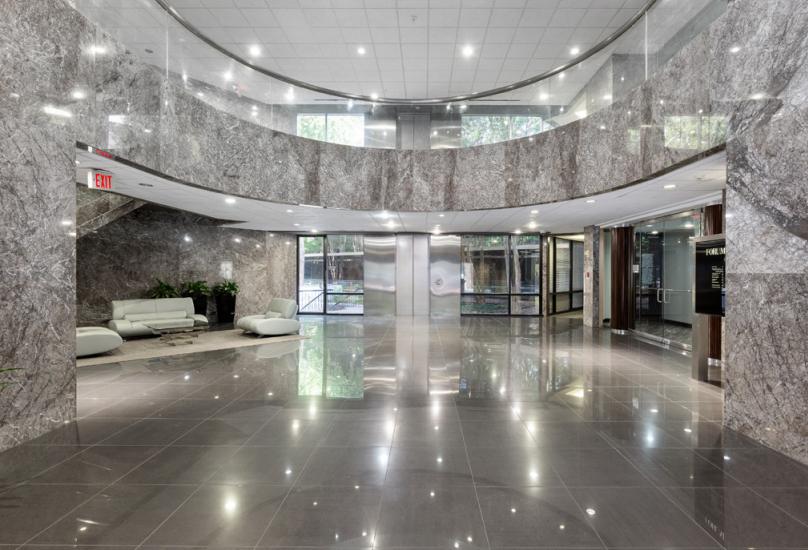
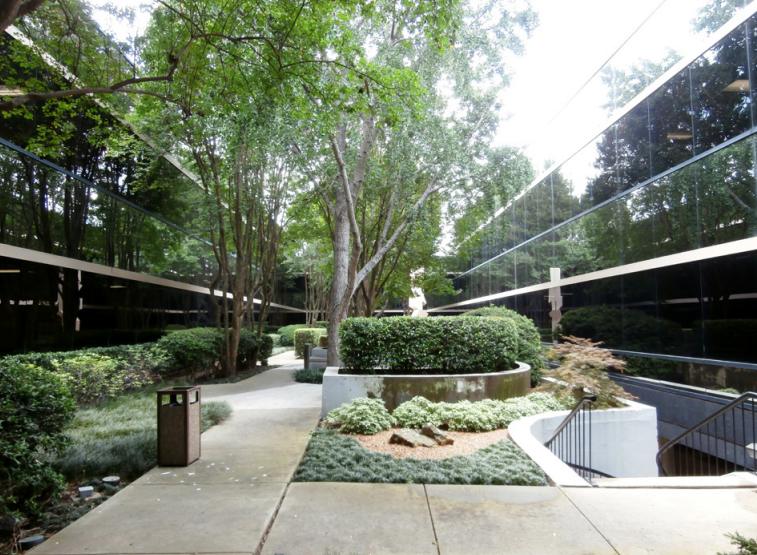
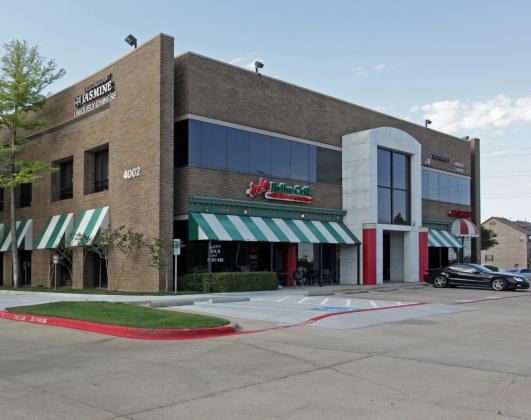
Additional Photos
Listing Agents

James Davis
O: 214-256-7103
M: 214-435-3382
jdavis@nairl.com
O: 214-256-7103
M: 214-435-3382
jdavis@nairl.com

Grant Frerichs
O: 214-256-7146
M: 214-601-0722
gfrerichs@nairl.com
O: 214-256-7146
M: 214-601-0722
gfrerichs@nairl.com

Justin Utay
O: 214-256-7166
M: 214-394-3148
jutay@nairl.com
O: 214-256-7166
M: 214-394-3148
jutay@nairl.com
While we strive to provide the most accurate information, all listing information, and demographic data, is provided by third-parties. As such, MyEListing will not be responsible for the accuracy of the information. It is strongly recommended that you verify all information with the listing agent, and any relevant agencies, prior to making any decisions.