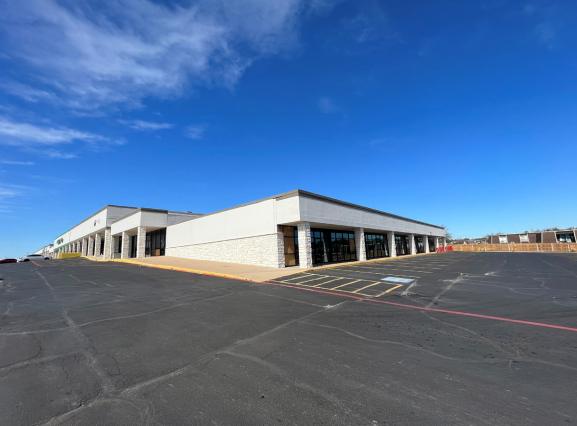
Retail Space
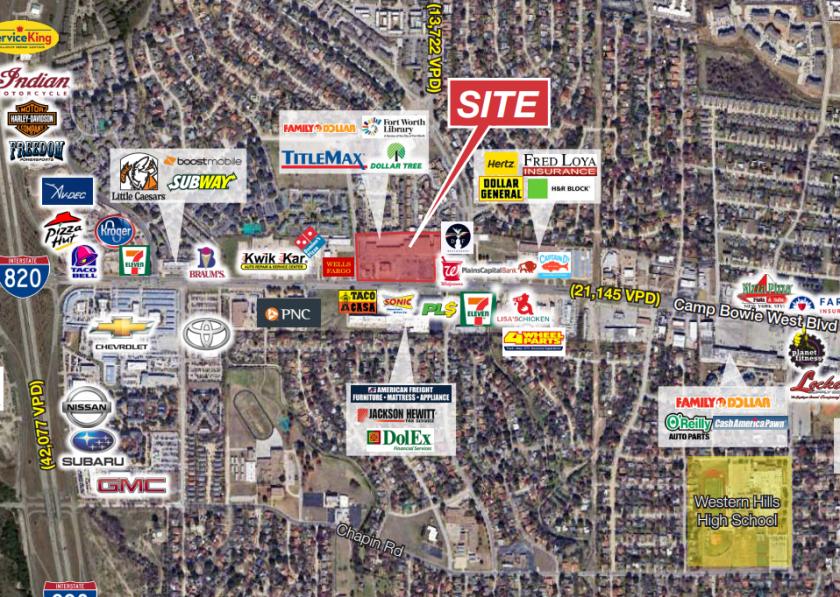
8628 - 8740 Camp Bowie W Blvd Fort Worth, TX 76116
8628 - 8740 Camp Bowie W Blvd Fort Worth, TX 76116

Details & Description
Property Highlights
- • Excellent Retail, Office and Flex Spaces Available
- • Co-Anchor & Junior Anchor Spaces Available
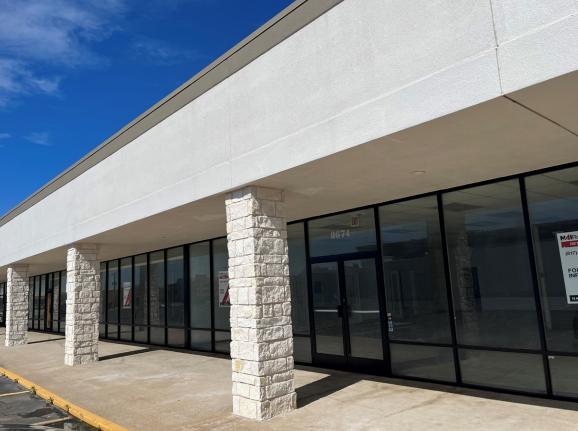
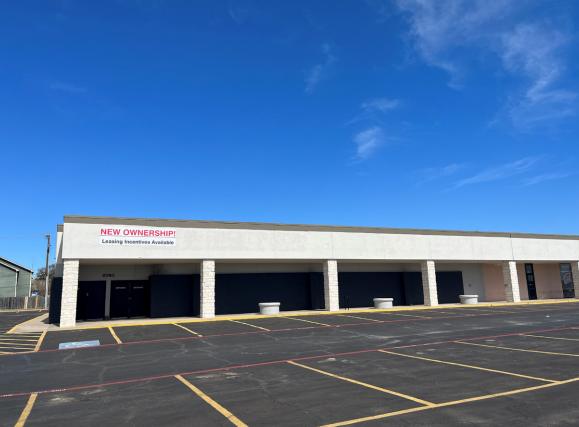
- • 2nd Gen Retail & White Box Spaces Available
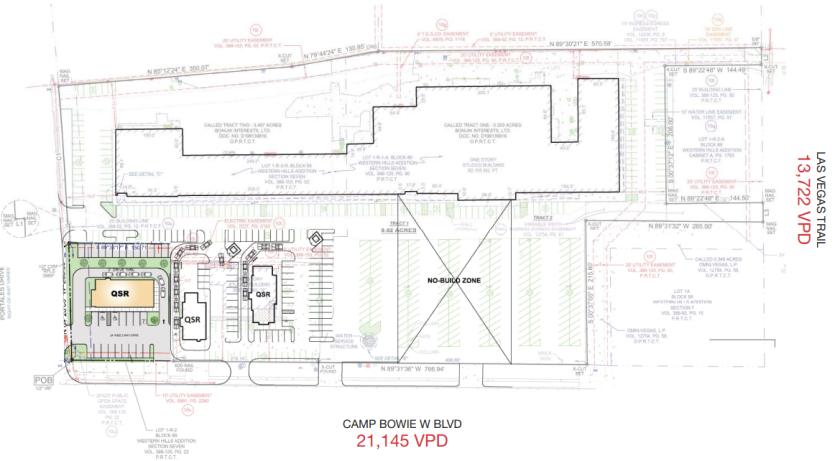
- • Multiple Pad Sites Available for Lease!
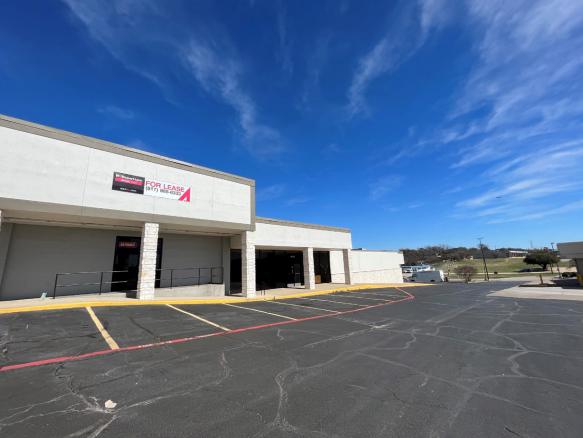
- • Pylon Signage Available
- • Close Proximity to Loop 820 & Interstate 30
Additional Photos

Listing Agents
Jake Blankenship
O: 817-872-3904
M: 512-415-4299
jblankenship@nairl.com
O: 817-872-3904
M: 512-415-4299
jblankenship@nairl.com
While we strive to provide the most accurate information, all listing information, and demographic data, is provided by third-parties. As such, MyEListing will not be responsible for the accuracy of the information. It is strongly recommended that you verify all information with the listing agent, and any relevant agencies, prior to making any decisions.