Industrial Properties
612 East Dallas Road Grapevine, TX 76051
612 East Dallas Road Grapevine, TX 76051

Details & Description
Property Highlights
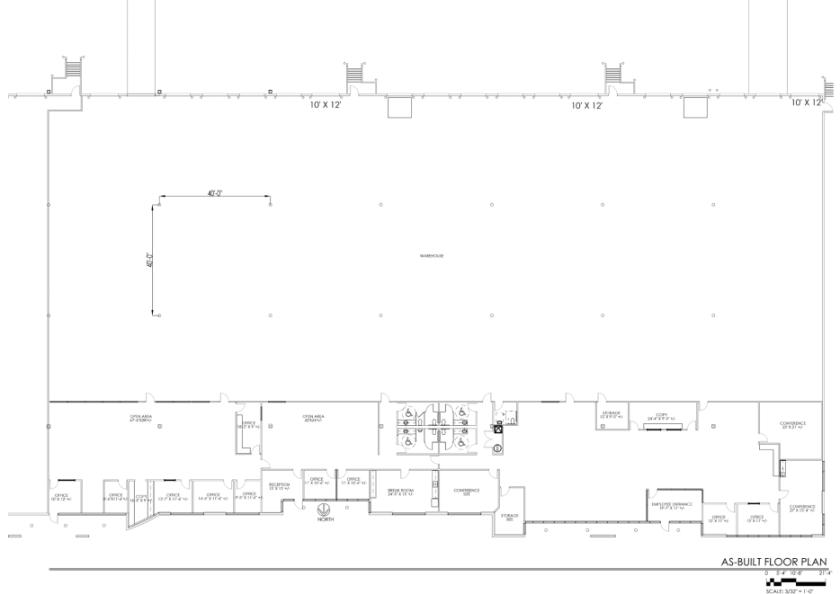
- • 12,500 SF Office
- • 24’ Clear Height
- • 16 Dock Doors (1 Door Per 2,400 SF)
- • 2 Grade Level Doors
- • Sprinklered
- • Close Proximity to I-635 and Highway 114
Listing Agents

Rick Medinis
O: 214-543-1248
M: 214-256-7116
rmedinis@nairl.com
O: 214-543-1248
M: 214-256-7116
rmedinis@nairl.com

Tyson Erwin
O: 214-256-7127
M: 214-514-6993
terwin@nairl.com
O: 214-256-7127
M: 214-514-6993
terwin@nairl.com
While we strive to provide the most accurate information, all listing information, and demographic data, is provided by third-parties. As such, MyEListing will not be responsible for the accuracy of the information. It is strongly recommended that you verify all information with the listing agent, and any relevant agencies, prior to making any decisions.