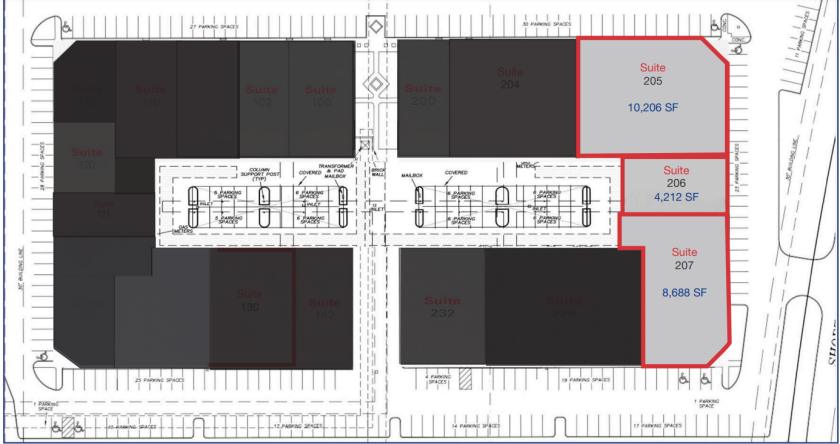
Office Space
3100 - 3150 Premier Dr Irving, TX 75063
3100 - 3150 Premier Dr Irving, TX 75063
Details & Description
Property Highlights
- • New Ownership
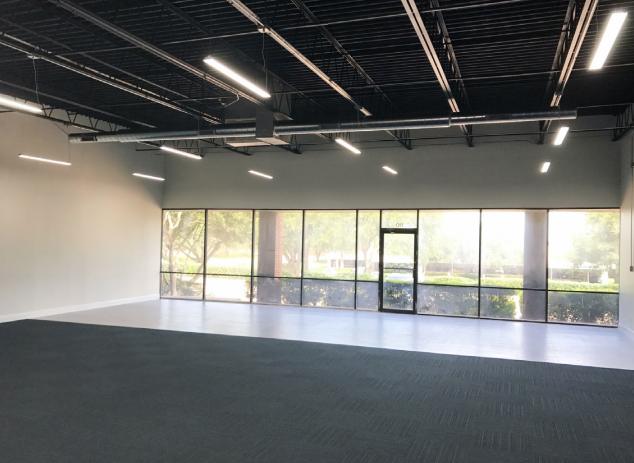
- • Recently Renovated One-Story Office Building
- • Move-In Ready Spaces Available
- • Covered Parking
Listing Agents

Zach Stevens
O: 214-256-7149
M: 214-918-0330
zstevens@nairl.com
O: 214-256-7149
M: 214-918-0330
zstevens@nairl.com
While we strive to provide the most accurate information, all listing information, and demographic data, is provided by third-parties. As such, MyEListing will not be responsible for the accuracy of the information. It is strongly recommended that you verify all information with the listing agent, and any relevant agencies, prior to making any decisions.