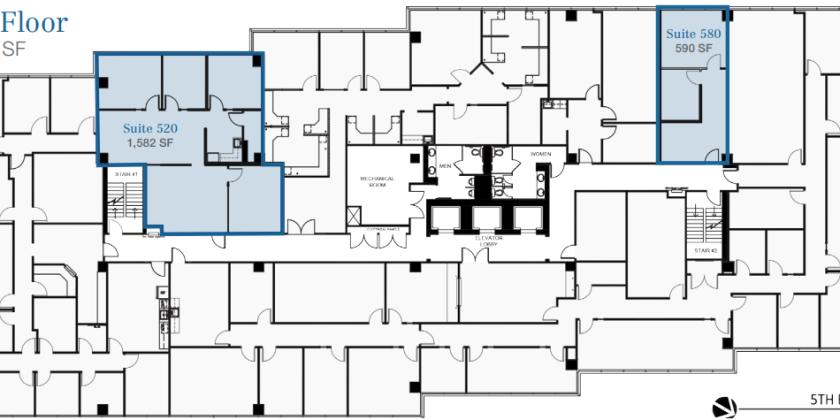
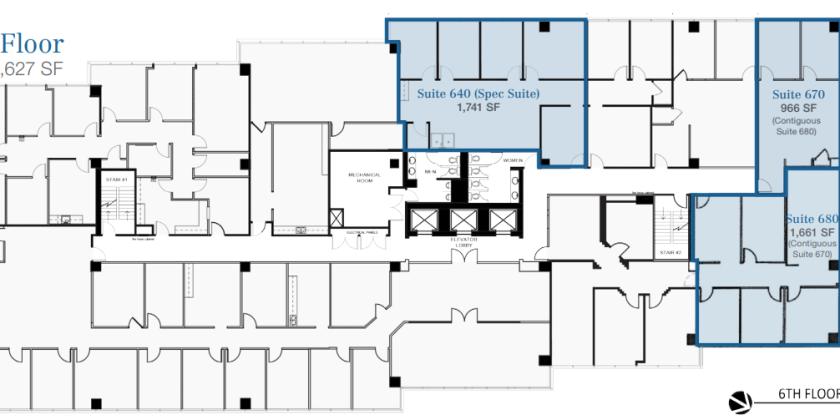
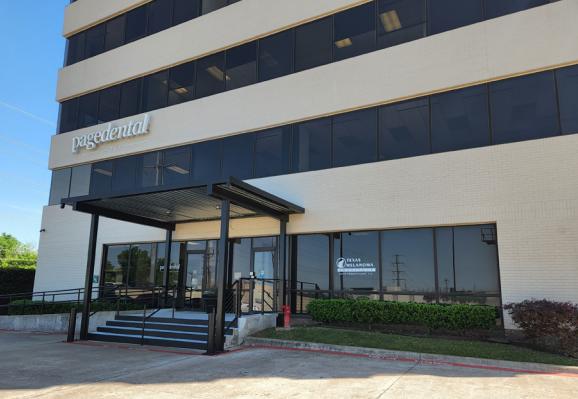
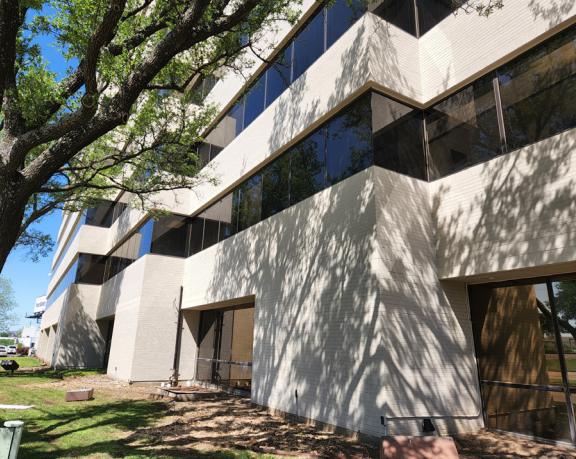
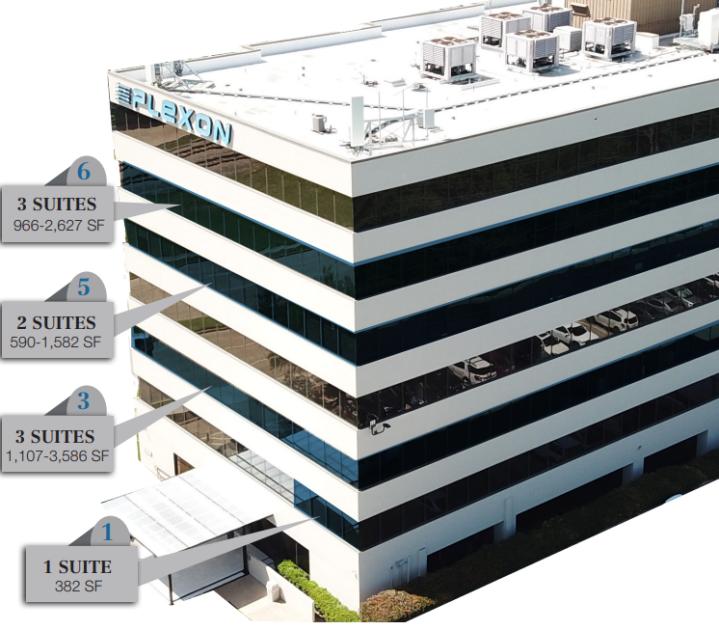
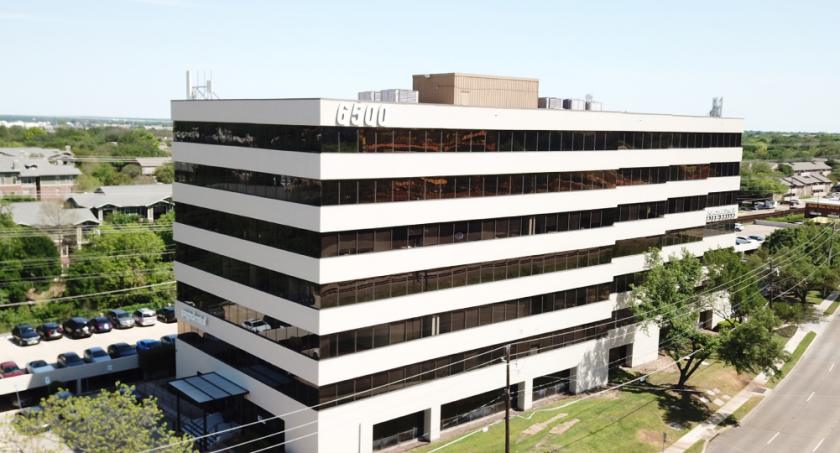
Office Space
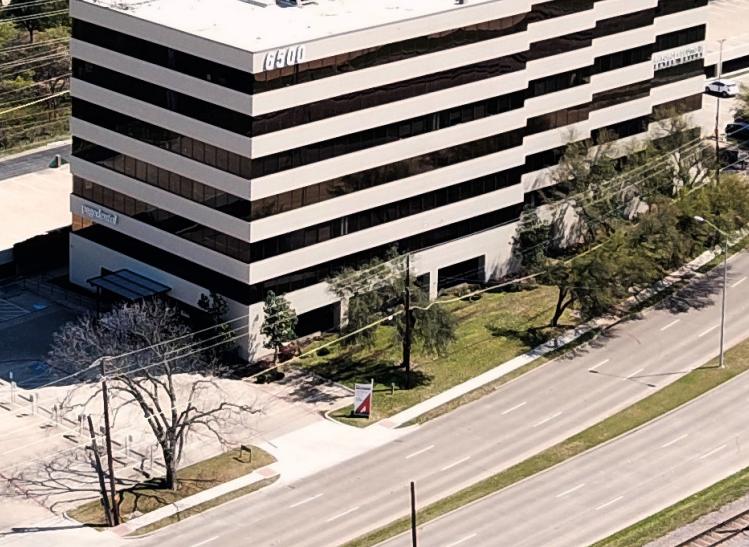
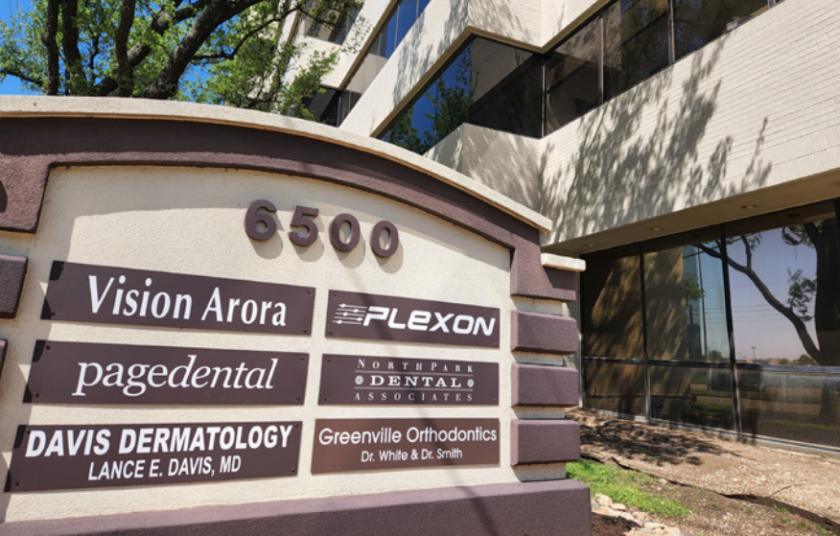
6500 Greenville Avenue Dallas, TX 75206
6500 Greenville Avenue Dallas, TX 75206
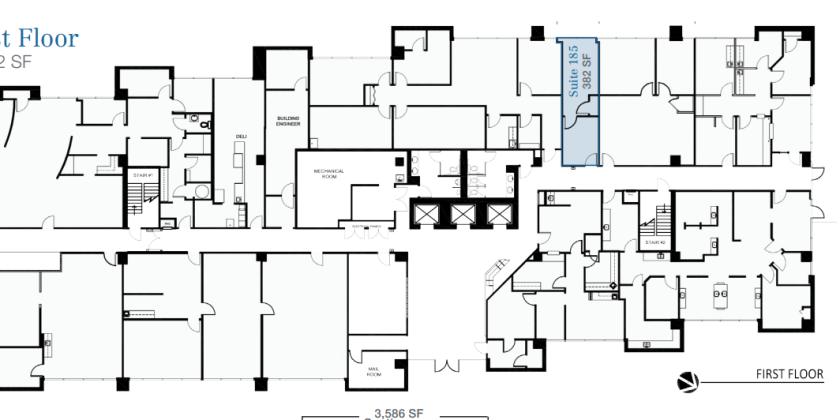
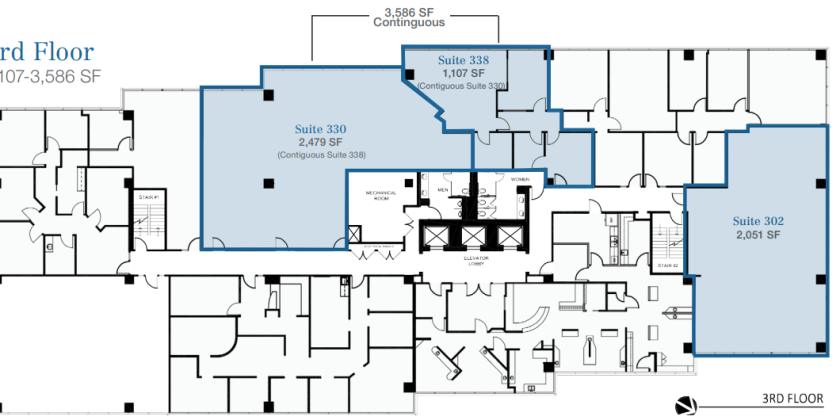
Details & Description
Property Highlights
- • Situated Near Hotels, Shopping and Restaurants
- • 24-Hour Key-Card Access
- • On-Site Security Guards
- • Less Than a Mile to DART Rail Station
- • Bus Stop Located on Property
- • Move-In Ready Suites
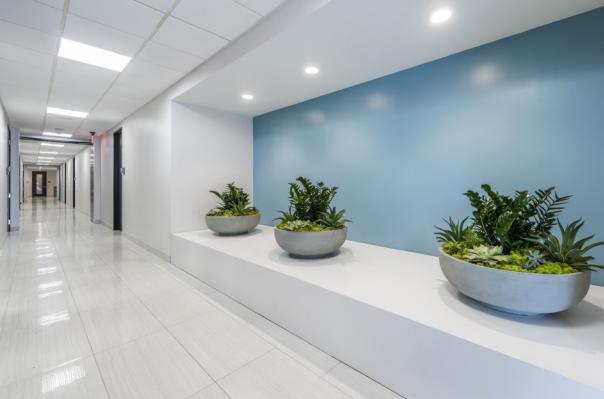
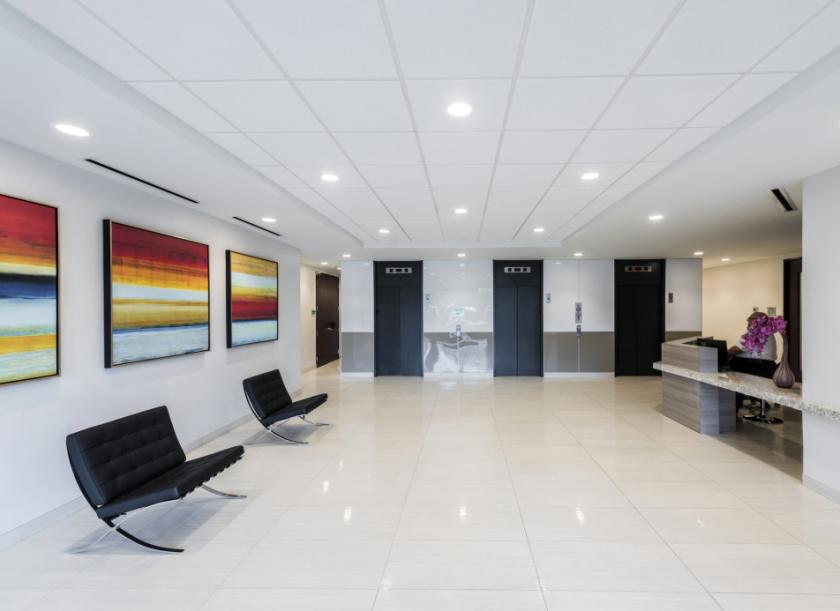
Additional Photos
Listing Agents

James Davis
O: 214-256-7103
M: 214-435-3382
jdavis@nairl.com
O: 214-256-7103
M: 214-435-3382
jdavis@nairl.com

Justin Utay
O: 214-256-7166
M: 214-394-3148
jutay@nairl.com
O: 214-256-7166
M: 214-394-3148
jutay@nairl.com

Grant Frerichs
O: 214-256-7146
M: 214-601-0722
gfrerichs@nairl.com
O: 214-256-7146
M: 214-601-0722
gfrerichs@nairl.com
While we strive to provide the most accurate information, all listing information, and demographic data, is provided by third-parties. As such, MyEListing will not be responsible for the accuracy of the information. It is strongly recommended that you verify all information with the listing agent, and any relevant agencies, prior to making any decisions.