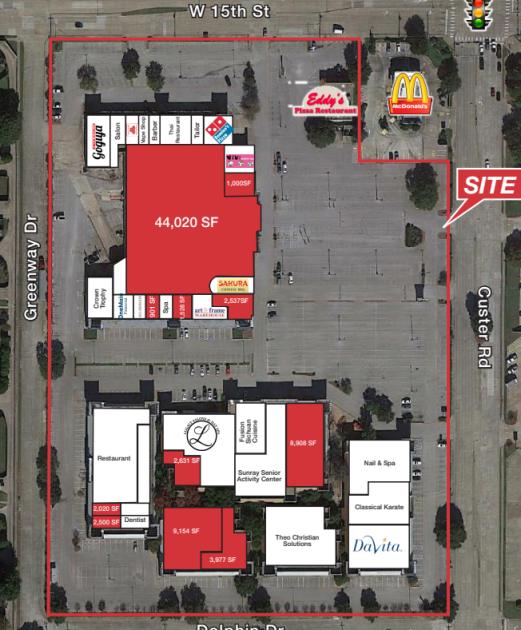
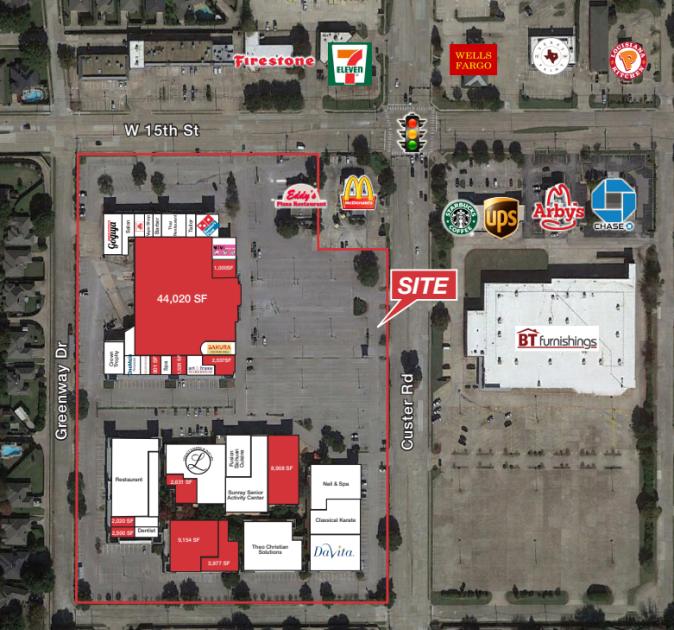
Retail Space
1301 Custer Road Plano, TX 75075
1301 Custer Road Plano, TX 75075
Details & Description
Property Highlights
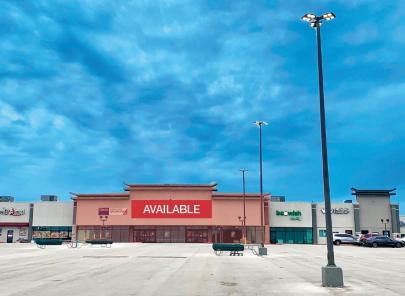
- • Anchor Space Available
- • Move-In Ready Former Grocery Store
- • Center Front Lighted Intersection
Listing Agents

Ryan Lee
O: 214-256-7143
M: 972-571-4296
rlee@nairl.com
O: 214-256-7143
M: 972-571-4296
rlee@nairl.com
While we strive to provide the most accurate information, all listing information, and demographic data, is provided by third-parties. As such, MyEListing will not be responsible for the accuracy of the information. It is strongly recommended that you verify all information with the listing agent, and any relevant agencies, prior to making any decisions.