Office Space
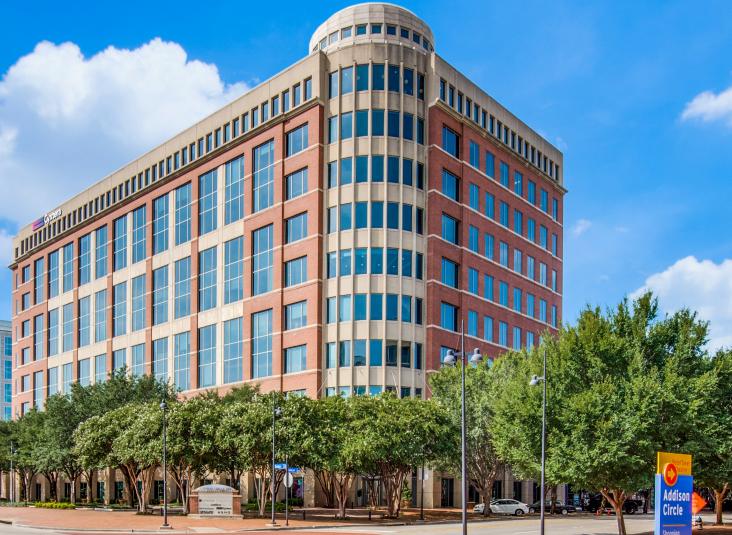
15601 Dallas Parkway Addison, TX 75001
15601 Dallas Parkway Addison, TX 75001
Details & Description
Property Highlights
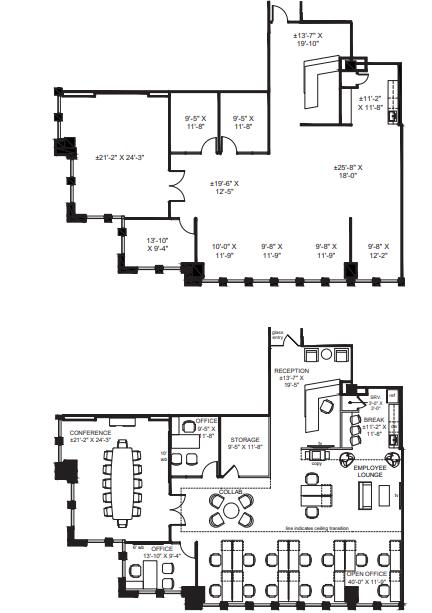
- • Suite 1075
- • Occupancy: Immediate
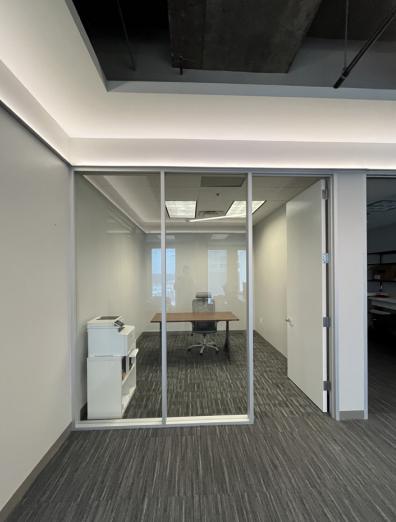
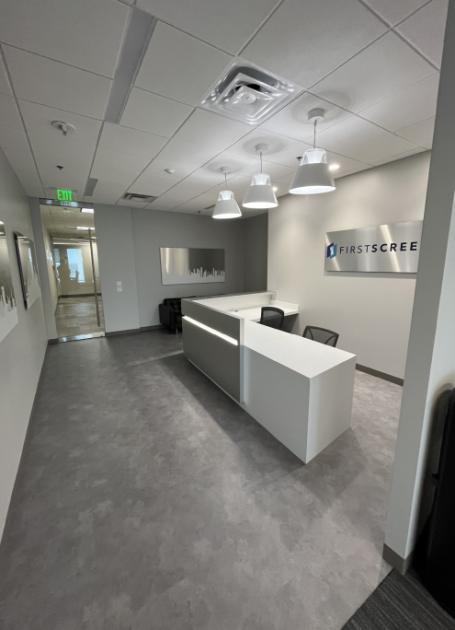
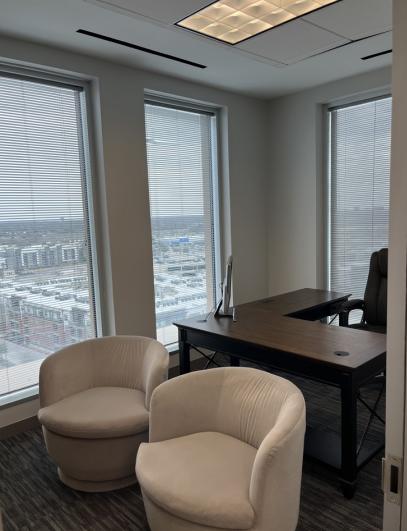
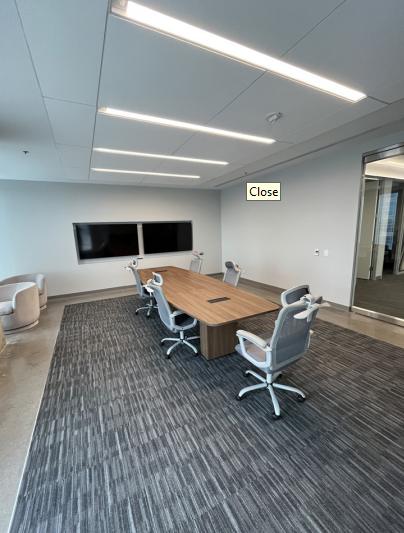
- • Excellent Condition. Primarily Open Layout
- • Furniture Negotiable
- • Walkable to 9 Restaurants
- • 12,000 SF Fitness Center On-Site
Additional Photos

Listing Agents

Jayson Montoya
O: 214-256-7136
M: 214-926-7347
jmontoya@nairl.com
O: 214-256-7136
M: 214-926-7347
jmontoya@nairl.com
While we strive to provide the most accurate information, all listing information, and demographic data, is provided by third-parties. As such, MyEListing will not be responsible for the accuracy of the information. It is strongly recommended that you verify all information with the listing agent, and any relevant agencies, prior to making any decisions.