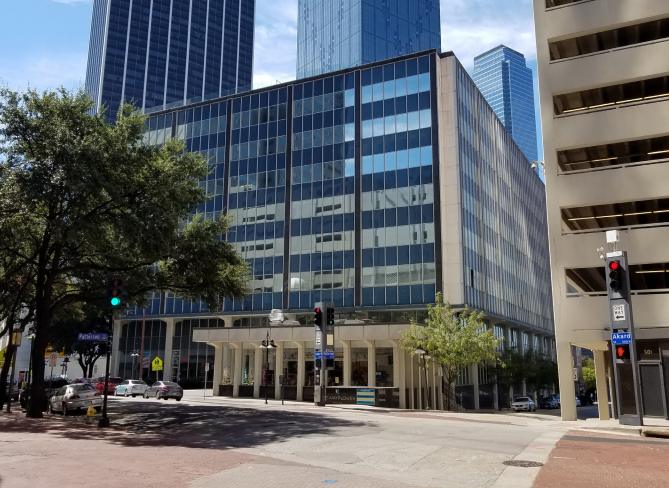
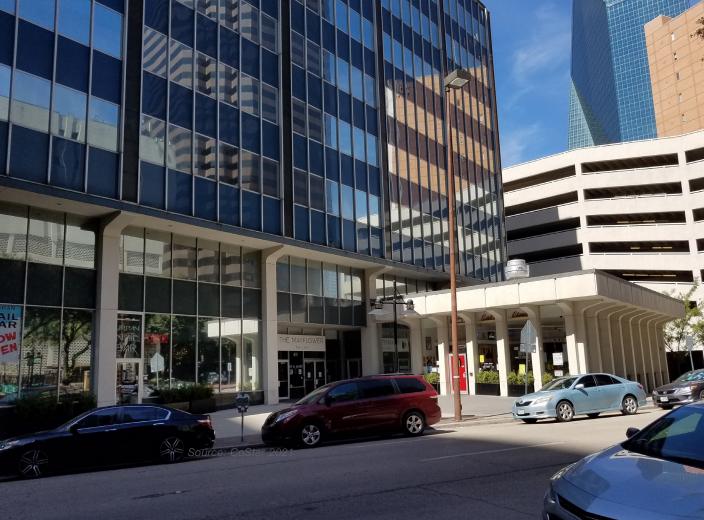
Office Space
411 North Akard Street Dallas, TX 75201
411 North Akard Street Dallas, TX 75201
Details & Description
Property Highlights
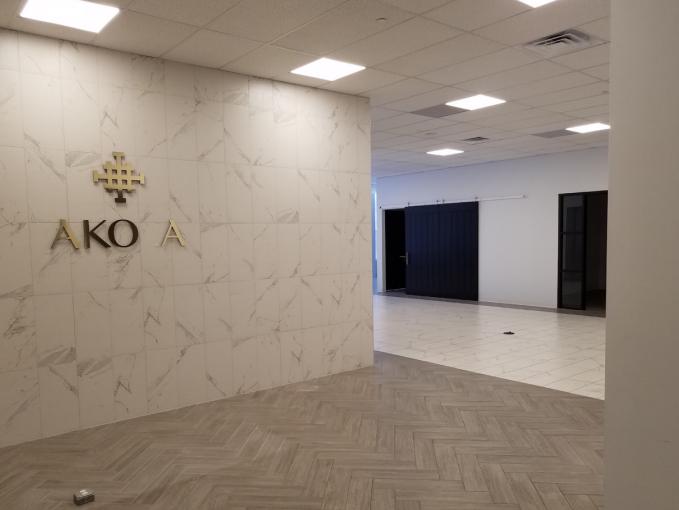
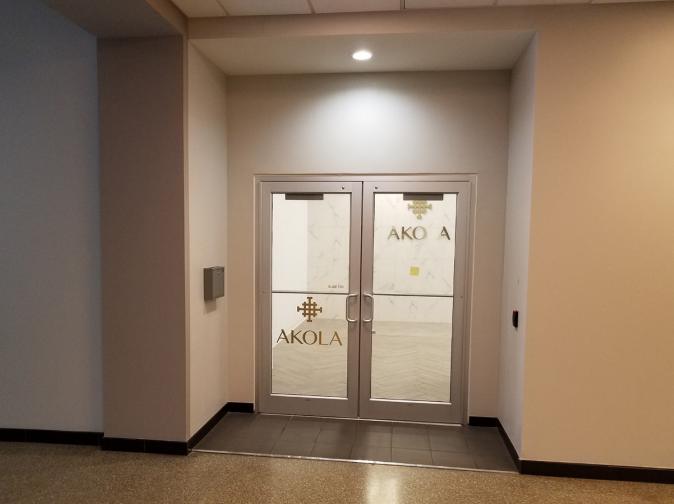
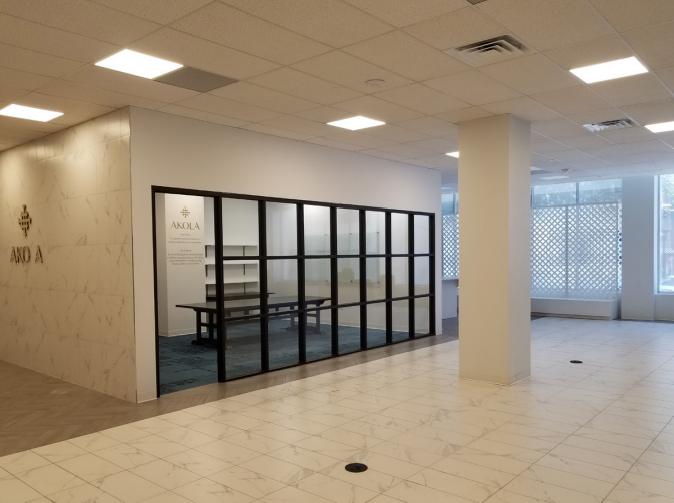
• Great Co-Tenancy with Other Retail Tenants: Salsa Limon, Urban Nail Bar and Becon Office
• Retail/Office Suite Located Within the Building Lobby
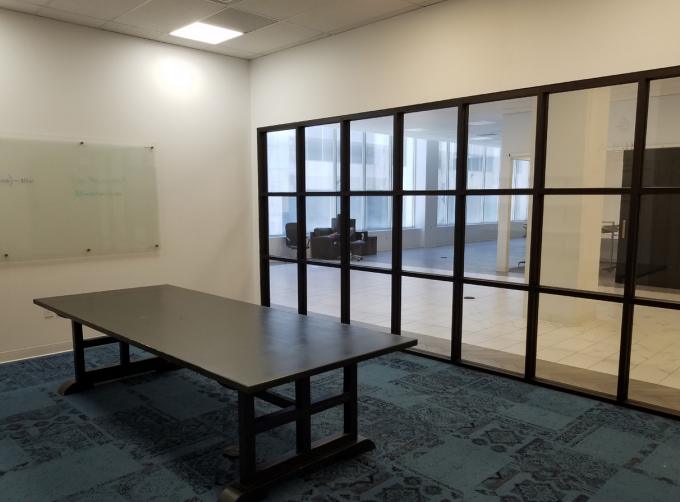
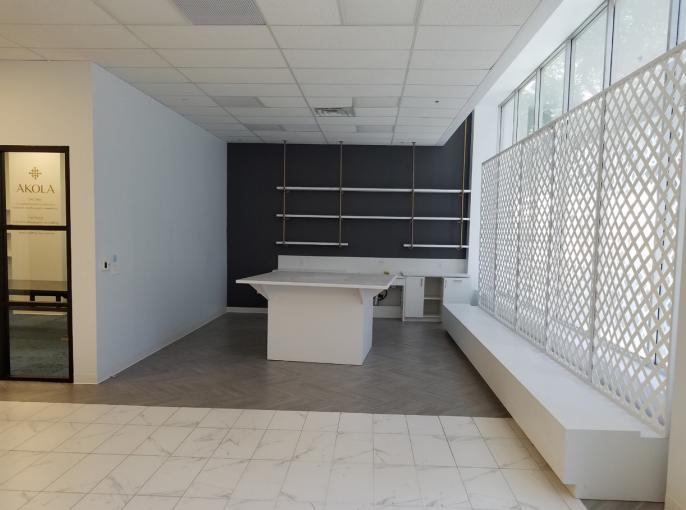
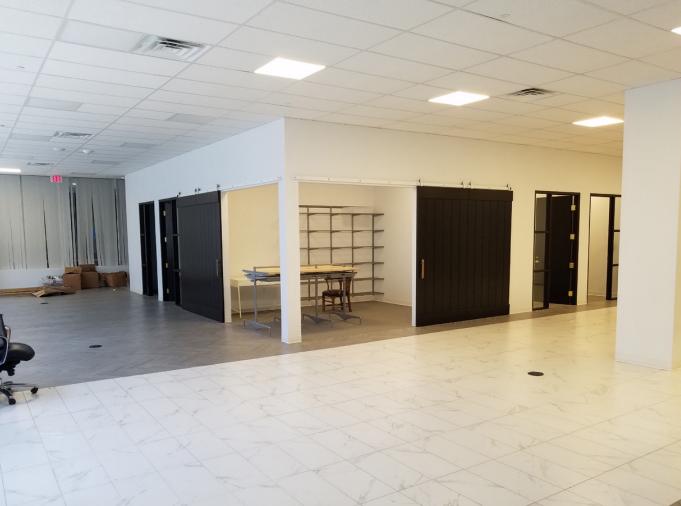
Additional Photos
Listing Agents

Tommy Tran
O: 214-256-7195
M: 817-371-5613
ttran@nairl.com
O: 214-256-7195
M: 817-371-5613
ttran@nairl.com
While we strive to provide the most accurate information, all listing information, and demographic data, is provided by third-parties. As such, MyEListing will not be responsible for the accuracy of the information. It is strongly recommended that you verify all information with the listing agent, and any relevant agencies, prior to making any decisions.