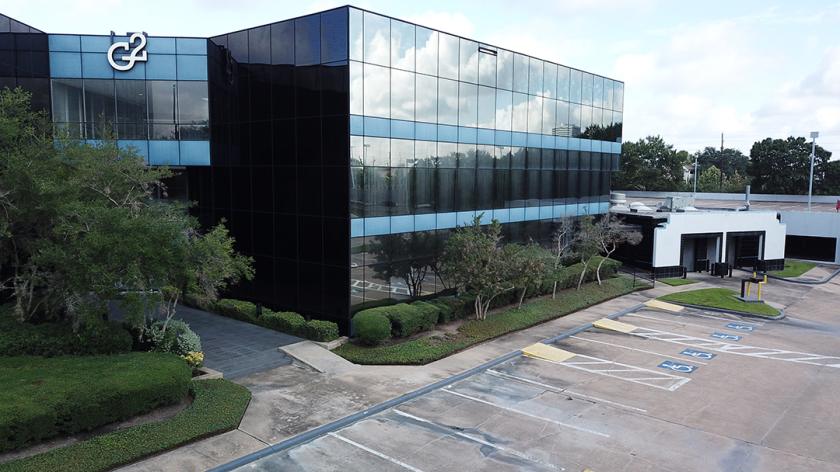
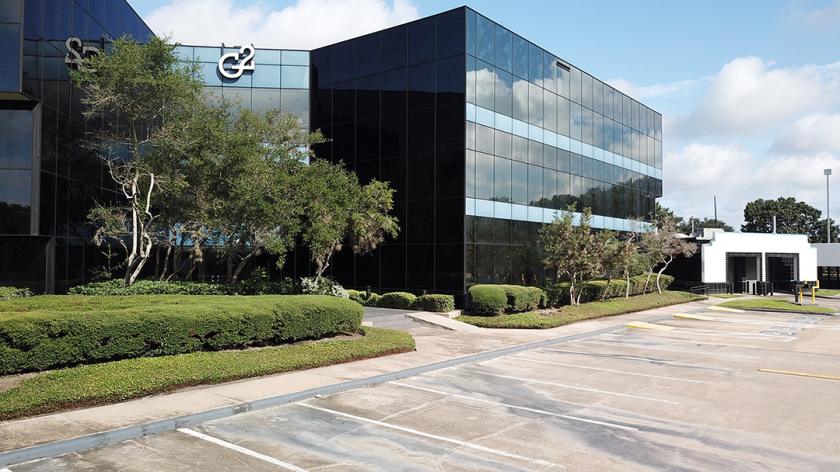
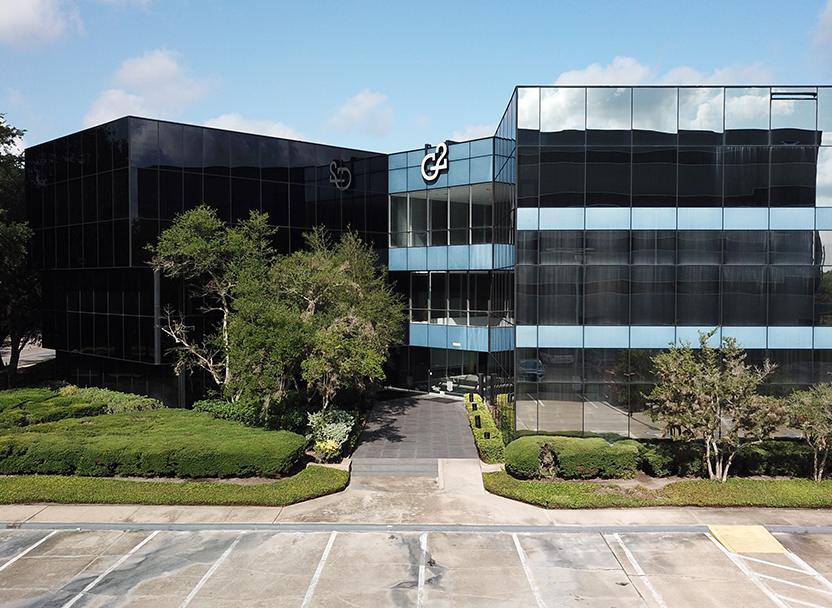
1-Mile | 3-Miles | 5-Miles | ||
---|---|---|---|---|
Total Population | 22,396 | 210,301 | 562,023 | |
Population Median Age | 33 | 35 | 35 | |
Population by Age | 0-9 Yrs | 3133 (13%) | 28896 (13%) | 83095 (14%) |
10-19 Yrs | 2481 (11%) | 26230 (12%) | 71727 (12%) | |
20-29 Yrs | 4804 (21%) | 34881 (16%) | 95322 (16%) | |
30-39 Yrs | 4806 (21%) | 37791 (17%) | 95731 (17%) | |
40-49 Yrs | 2865 (12%) | 27985 (13%) | 73327 (13%) | |
50-59 Yrs | 1915 (8%) | 22183 (10%) | 60471 (10%) | |
60-69 Yrs | 1220 (5%) | 17154 (8%) | 45581 (8%) | |
70+ Yrs | 1171 (5%) | 15183 (7%) | 36767 (6%) | |
Median HH Income | $44,819 | $48,000 | $48,754 | |
Total Household Income | < 24K | 2645 (25%) | 21161 (24%) | 51208 (23%) |
25-49K | 3325 (31%) | 22980 (27%) | 58677 (27%) | |
50-74K | 1888 (18%) | 14460 (17%) | 36546 (17%) | |
75-99K | 885 (8%) | 8173 (9%) | 22331 (10%) | |
100-199K | 1190 (11%) | 12190 (14%) | 29784 (13%) | |
200K+ | 553 (5%) | 5889 (6%) | 16205 (7%) | |
Highest Education Level | No Diploma | 1732 | 24928 | 73115 |
Diploma or GED | 2853 | 29371 | 76068 | |
Some College | 3308 | 24425 | 62751 | |
Assoc. Degree | 1000 | 8709 | 23273 | |
Bachelors Degree | 3709 | 34258 | 86313 | |
Higher Degree | 2342 | 18957 | 45687 | |
Total Housing Units | 11,696 | 95,736 | 242,626 | |
--Owner-Occupied | 1,809 | 28,341 | 71,627 | |
--Renter-Occupied | 8,677 | 56,511 | 143,122 | |
Owner-Occupied Values | < 100K | 399 | 4488 | 10205 |
100-199K | 376 | 8268 | 24104 | |
200-299K | 294 | 5556 | 11980 | |
300-399K | 261 | 3948 | 6749 | |
400-499K | 111 | 1497 | 3372 | |
500K+ | 369 | 4584 | 15219 | |
Total Working Age Population | 17,974 | 165,033 | 433,117 | |
In Work Force | 13,537 | 115,481 | 299,894 | |
Not In Work Force | 4,437 | 49,553 | 133,222 | |
Workforce Employed | 12,664 | 108,760 | 280,917 | |
Workforce Unemployed | 750 | 6,474 | 18,424 | |
Civlian Workforce | 13,414 | 115,234 | 299,340 | |
Military Workforce | 123 | 247 | 554 | |
Total Households | 10,486 | 84,852 | 214,750 | |
Family Households | 5,498 | 50,236 | 132,270 | |
Non-Family Households | 4,987 | 34,616 | 82,480 | |
Married Couple | 3,148 | 31,293 | 84,232 | |
Other Family | 2,351 | 18,943 | 48,038 | |
Married w/Child | 1,376 | 14,048 | 40,820 | |
Single Male w/Child | 426 | 2,002 | 5,658 | |
Single Female w/Child | 913 | 8,280 | 19,766 |
Population Change Last Two Decades - Plus Projection
2000 | % | 2010 | % | 2020 | % | 2030 | |
---|---|---|---|---|---|---|---|
Texas | 20,851,820 | +21 | 25,145,561 | +18 | 29,677,668 | +18 | 34,894,452 |
Fort Bend County | 354,452 | +65 | 585,375 | +44 | 840,383 | +43 | 1,203,029 |
Harris County | 3,400,578 | +20 | 4,092,459 | +22 | 4,978,845 | +19 | 5,924,750 |
Total Working Age Population:
Total Households:
Total Working Age Population:
Total Households:
Total Working Age Population:
Total Households: