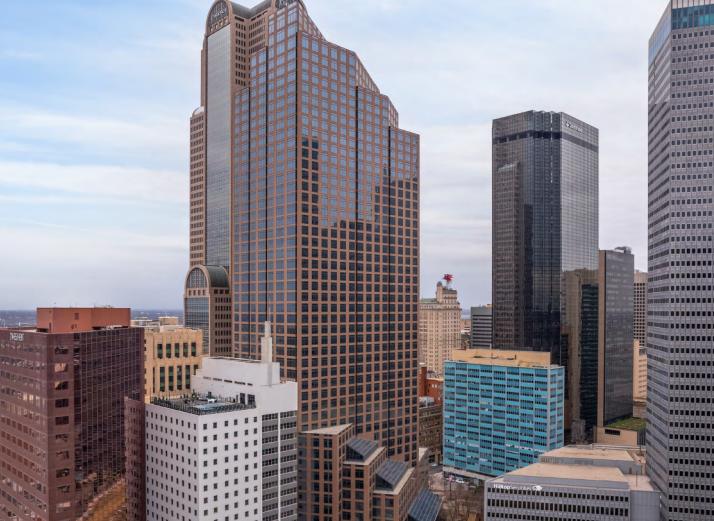
1-Mile | 3-Miles | 5-Miles | ||
---|---|---|---|---|
Total Population | 21,951 | 158,775 | 368,541 | |
Population Median Age | 36 | 36 | 36 | |
Population by Age | 0-9 Yrs | 700 (3%) | 11490 (7%) | 41946 (11%) |
10-19 Yrs | 542 (2%) | 11093 (6%) | 39697 (10%) | |
20-29 Yrs | 7633 (34%) | 43762 (27%) | 78366 (21%) | |
30-39 Yrs | 6166 (28%) | 35646 (22%) | 66149 (17%) | |
40-49 Yrs | 2767 (12%) | 19539 (12%) | 46340 (12%) | |
50-59 Yrs | 2562 (11%) | 17546 (11%) | 42120 (11%) | |
60-69 Yrs | 1133 (5%) | 12031 (7%) | 32519 (8%) | |
70+ Yrs | 450 (2%) | 7667 (4%) | 21403 (5%) | |
Median HH Income | $90,736 | $71,727 | $66,490 | |
Total Household Income | < 24K | 1612 (12%) | 13875 (17%) | 30923 (19%) |
25-49K | 1512 (11%) | 13169 (16%) | 29469 (18%) | |
50-74K | 2249 (16%) | 14680 (18%) | 27576 (17%) | |
75-99K | 2075 (15%) | 10256 (12%) | 18181 (11%) | |
100-199K | 4304 (32%) | 18921 (23%) | 32330 (20%) | |
200K+ | 1606 (12%) | 9083 (11%) | 20570 (12%) | |
Highest Education Level | No Diploma | 621 | 17520 | 46575 |
Diploma or GED | 1434 | 16956 | 43019 | |
Some College | 2588 | 18946 | 37392 | |
Assoc. Degree | 965 | 5465 | 10622 | |
Bachelors Degree | 7992 | 38867 | 71688 | |
Higher Degree | 4575 | 23626 | 46734 | |
Total Housing Units | 15,678 | 92,259 | 179,313 | |
--Owner-Occupied | 2,186 | 20,821 | 60,166 | |
--Renter-Occupied | 11,172 | 59,161 | 98,884 | |
Owner-Occupied Values | < 100K | 66 | 2802 | 10418 |
100-199K | 116 | 3923 | 11879 | |
200-299K | 517 | 2814 | 7218 | |
300-399K | 496 | 3084 | 6477 | |
400-499K | 199 | 2788 | 5818 | |
500K+ | 791 | 5410 | 18355 | |
Total Working Age Population | 20,950 | 140,658 | 302,251 | |
In Work Force | 17,819 | 105,715 | 213,710 | |
Not In Work Force | 3,131 | 34,943 | 88,542 | |
Workforce Employed | 17,136 | 100,863 | 202,840 | |
Workforce Unemployed | 683 | 4,807 | 10,747 | |
Civlian Workforce | 17,819 | 105,670 | 213,588 | |
Military Workforce | 0 | 45 | 122 | |
Total Households | 13,358 | 79,983 | 159,050 | |
Family Households | 3,146 | 26,596 | 72,870 | |
Non-Family Households | 10,213 | 53,387 | 86,179 | |
Married Couple | 2,379 | 18,264 | 48,792 | |
Other Family | 766 | 8,332 | 24,078 | |
Married w/Child | 340 | 4,835 | 18,977 | |
Single Male w/Child | 83 | 785 | 2,226 | |
Single Female w/Child | 342 | 3,124 | 9,411 |
Population Change Last Two Decades - Plus Projection
2000 | % | 2010 | % | 2020 | % | 2030 | |
---|---|---|---|---|---|---|---|
Texas | 20,851,820 | +21 | 25,145,561 | +18 | 29,677,668 | +18 | 34,894,452 |
Dallas County | 2,218,899 | +7 | 2,368,139 | +15 | 2,734,111 | +14 | 3,106,298 |
Total Working Age Population:
Total Households:
Total Working Age Population:
Total Households:
Total Working Age Population:
Total Households: