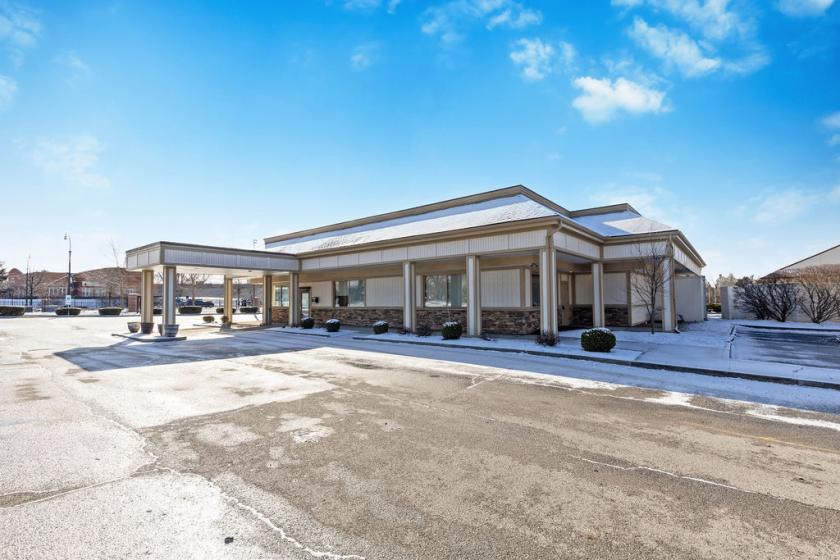
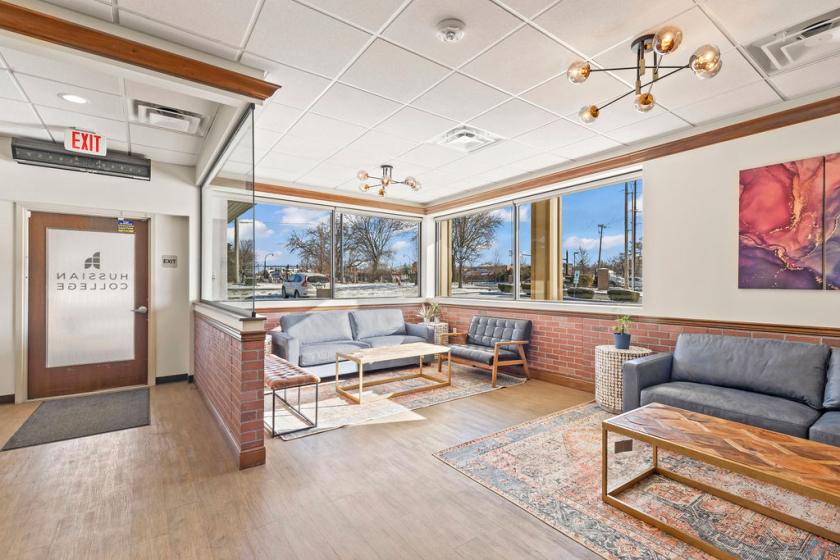
Office Space
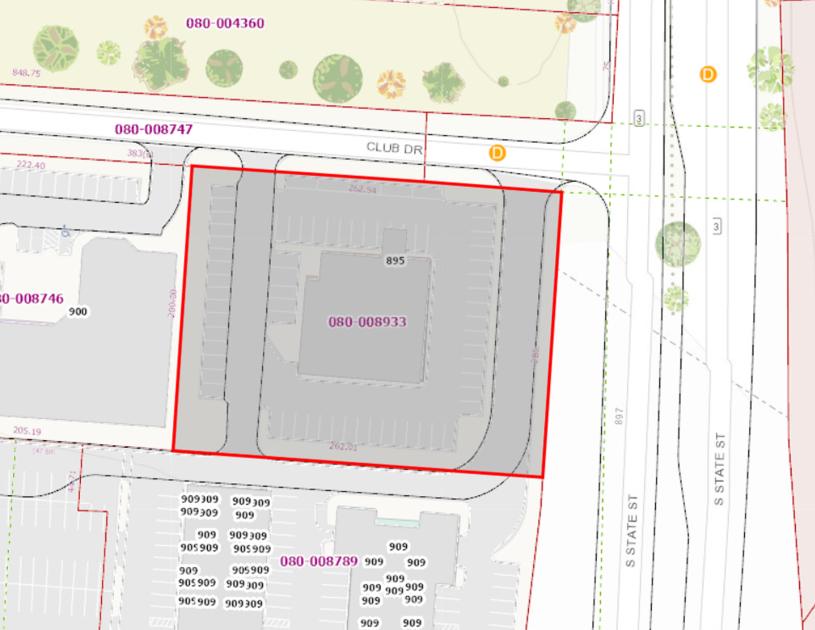
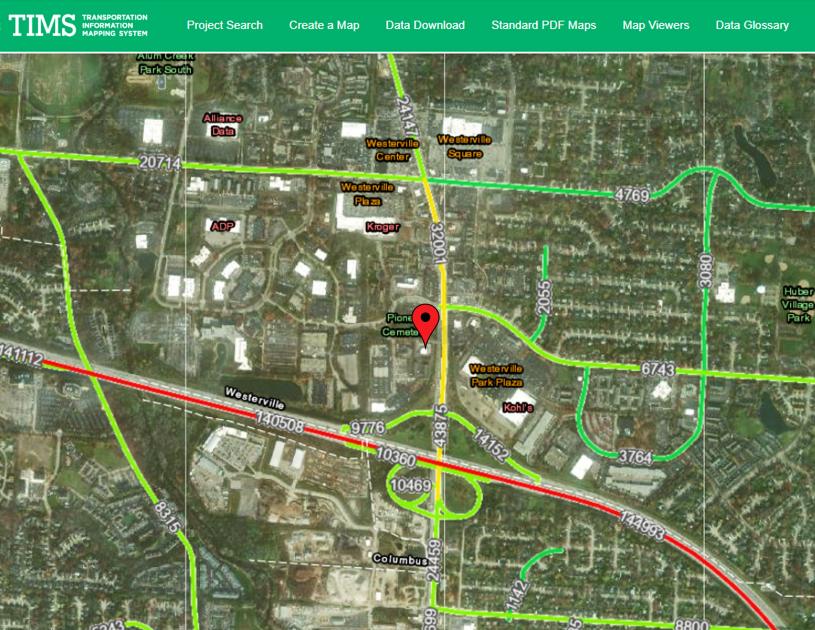
895 South State Street Westerville, OH 43081
895 South State Street Westerville, OH 43081

Details & Description
Property Highlights
- • Great Westerville location
- • Renovated within the past 5 years
- • Has new HVAC throughout
- • Perfect for an owner user.
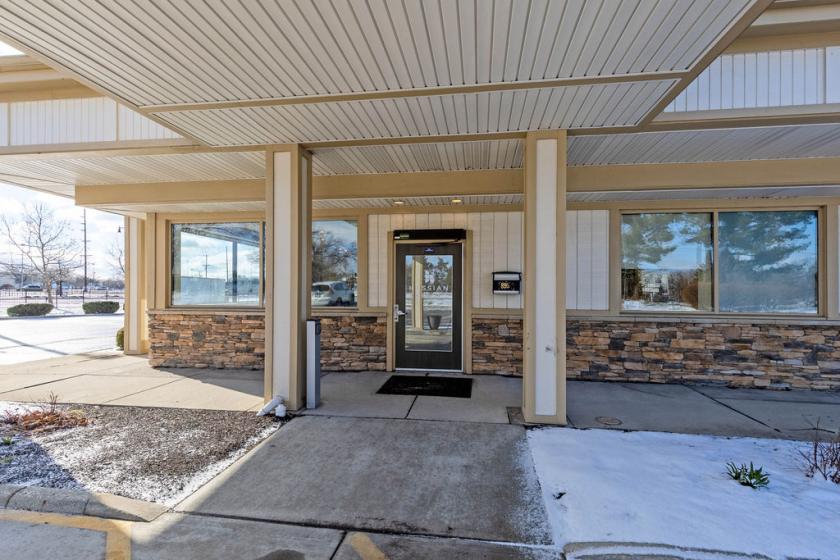
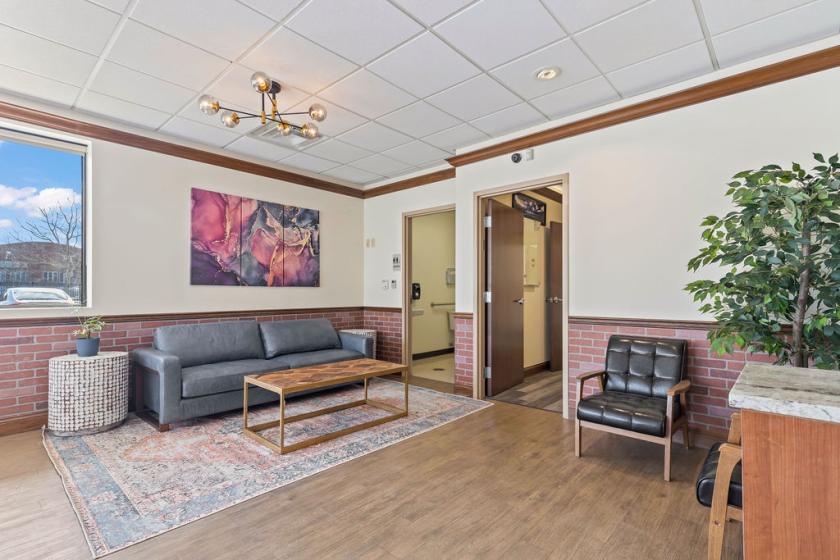
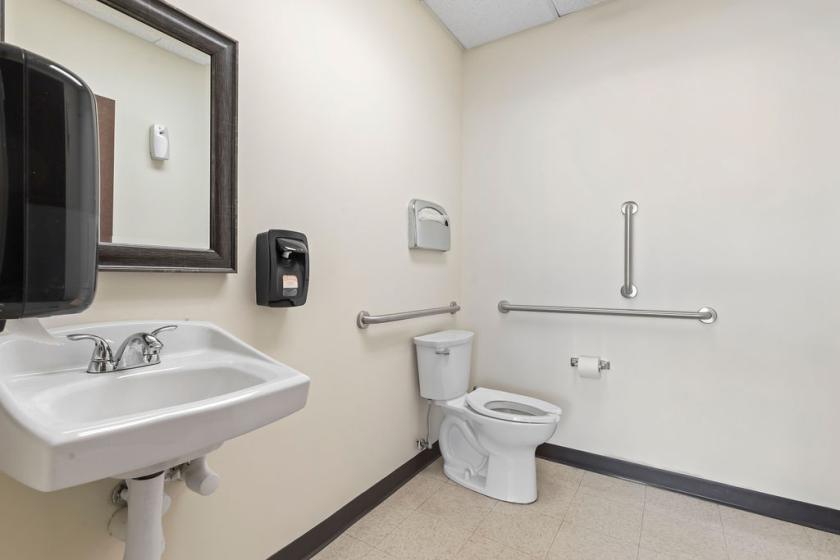
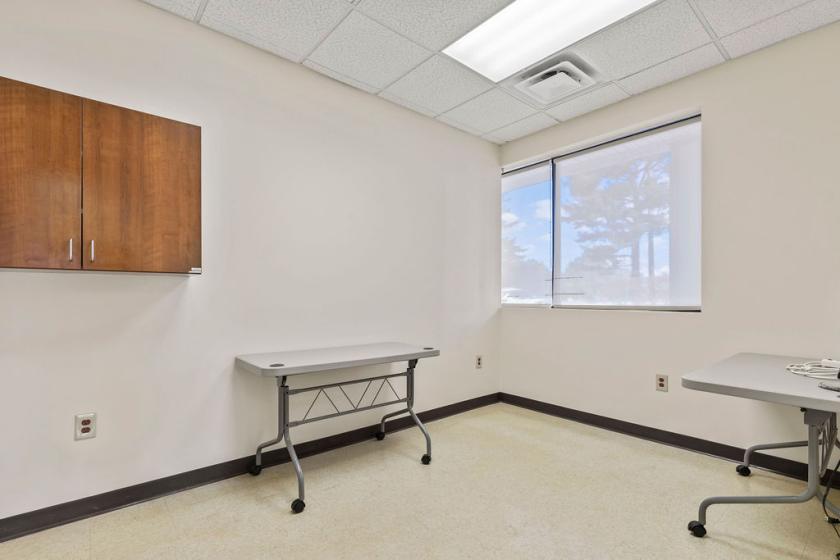
Additional Photos


Listing Agents

Alex Marsh
O: 614-245-2182
M: 614-937-3658
amarsh@rweiler.com
O: 614-245-2182
M: 614-937-3658
amarsh@rweiler.com
While we strive to provide the most accurate information, all listing information, and demographic data, is provided by third-parties. As such, MyEListing will not be responsible for the accuracy of the information. It is strongly recommended that you verify all information with the listing agent, and any relevant agencies, prior to making any decisions.