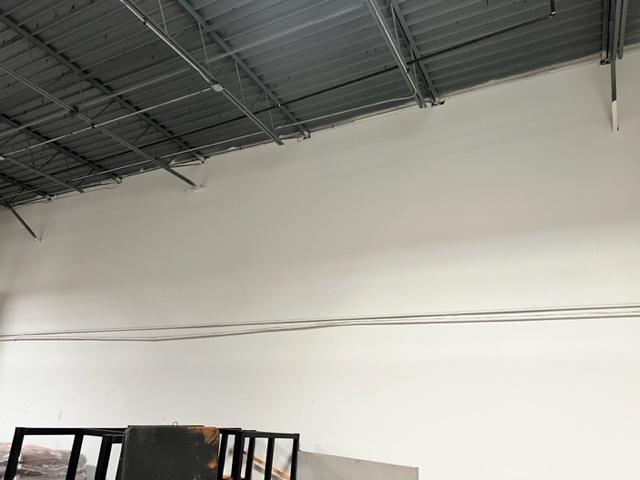
Looking to for 1 tenant to fill 2,000 sq ft of available warehouse space
$1.67 per sq ft per month
2,000 total sq ft available for rent
Tenants are allowed to work the space.
One tenant only, not a shared space.
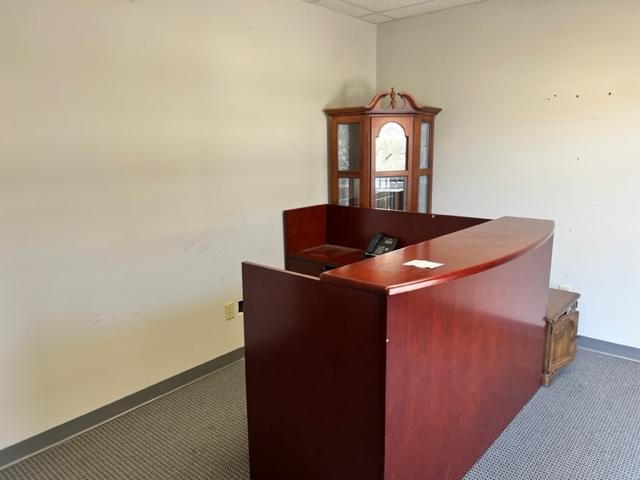
3 offices available (1,000 sqft total).
1 tenant is for the Warehouse space (2000 sqft )
24/7 access.
Storage allowed.
Wood work allowed, must take the whole space.
No auto work.
No hazardous materials.
No utilities included (negotiable, pending use).
Book a tour or view full warehouse details here: https://www.warehouseexchange.com/warehouse/1133
If you are interested in this facility please fill out the form below, it is sent directly to me. I will have the tenant manager respond back to you to book a tour to see the space and discuss pricing: https://share.hsforms.com/1ZK3ynKGAQb6AkLKipzmcUQbvwy5
Search warehouses for rent across the USA and book a tour or reserve warehouse space today, just visit www.warehouseexchange.com.
If you would like to talk about the property give us a call at (424) 239-2738
No part of this information may be copied, reproduced, repurposed, or screen-captured for any commercial purpose without prior written authorization from MyEListing.
While we strive to provide the most accurate information, all listing information, and demographic data, is provided by third-parties. As such, MyEListing will not be responsible for the accuracy of the information. It is strongly recommended that you verify all information with the listing agent, and any relevant agencies, prior to making any decisions.
What is the building size of this commercial Industrial property?
The size of this lease property at '.2433 Lacy Lane.' is 2000 square feet
What kind of Industrial is the propery at 2433 Lacy Lane?
The property at 2433 Lacy Lane Carrollton, TX 75006 is listed as a Warehouse Industrial property
What is the population within 1 mile of 2433 Lacy Lane in Carrollton?
The population within 1 mile of 2433 Lacy Lane Carrollton, TX 75006 is 1,363 people.
Who do I contact for questions about 2433 Lacy Lane?
You should contact the listing agent,
Warehouse Exchange, for any details regarding this commercial listing.