Industrial Properties
117 North Standard Avenue Santa Ana, CA 92701
117 North Standard Avenue Santa Ana, CA 92701
Details & Description
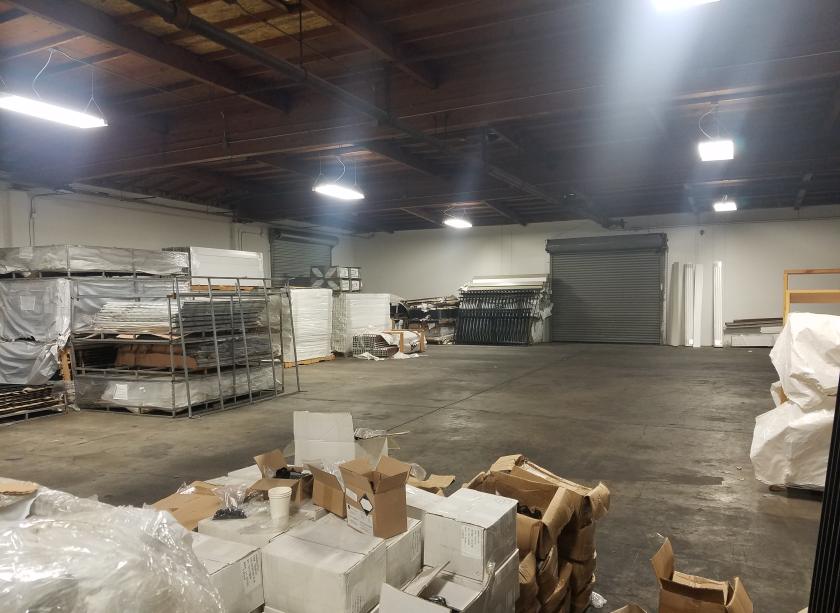
Additional Photos


Listing Agents

Warehouse Exchange
O: 424-239-2738
M: 424-239-2738
mtimko@warehouseexchange.com
O: 424-239-2738
M: 424-239-2738
mtimko@warehouseexchange.com
While we strive to provide the most accurate information, all listing information, and demographic data, is provided by third-parties. As such, MyEListing will not be responsible for the accuracy of the information. It is strongly recommended that you verify all information with the listing agent, and any relevant agencies, prior to making any decisions.


