Commercial Land
10601 - 10697 Melody Dr Northglenn, CO 80234
10601 - 10697 Melody Dr Northglenn, CO 80234
Details & Description
Property Highlights
- • C-5, Northglenn Zoning
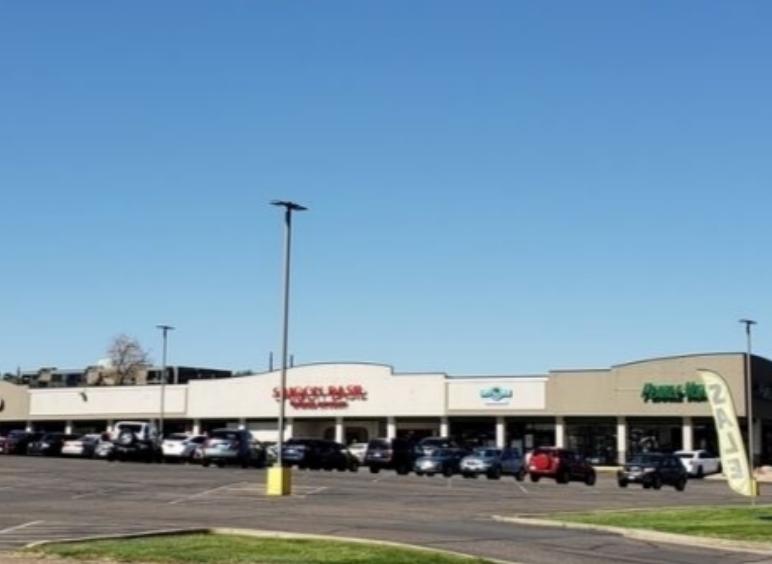
- • Join Dollar Tree, Kid to Kid & Pearle Vision
- • Strong tenant mix
- • Local Management
- • Ample parking
- • Monument signage
Listing Agents

Charles Nusbaum
O: 303-454-5420
cnusbaum@antonoff.com
O: 303-454-5420
cnusbaum@antonoff.com
While we strive to provide the most accurate information, all listing information, and demographic data, is provided by third-parties. As such, MyEListing will not be responsible for the accuracy of the information. It is strongly recommended that you verify all information with the listing agent, and any relevant agencies, prior to making any decisions.


