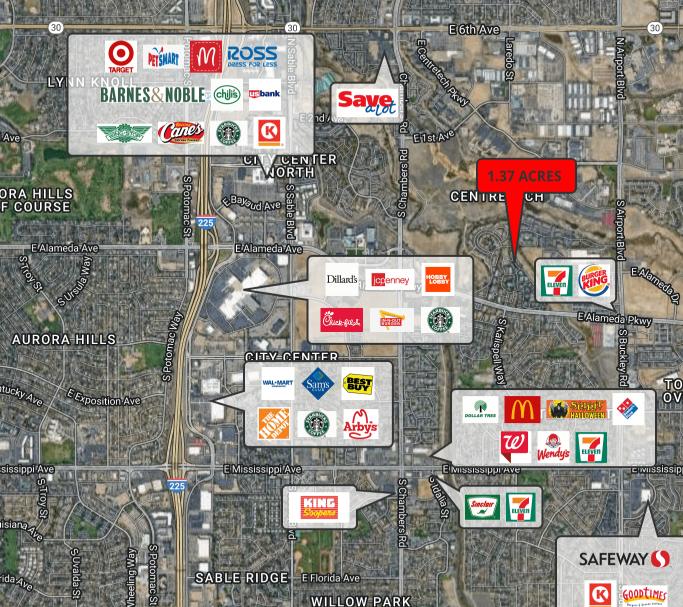
1-Mile | 3-Miles | 5-Miles | ||
---|---|---|---|---|
Total Population | 16,978 | 143,782 | 349,998 | |
Population Median Age | 33 | 35 | 36 | |
Population by Age | 0-9 Yrs | 2418 (14%) | 21110 (14%) | 46508 (13%) |
10-19 Yrs | 2368 (13%) | 18750 (13%) | 43950 (12%) | |
20-29 Yrs | 3529 (20%) | 24645 (17%) | 57894 (16%) | |
30-39 Yrs | 2567 (15%) | 22470 (15%) | 55538 (15%) | |
40-49 Yrs | 1809 (10%) | 18879 (13%) | 46838 (13%) | |
50-59 Yrs | 2111 (12%) | 16479 (11%) | 39565 (11%) | |
60-69 Yrs | 1399 (8%) | 12544 (8%) | 32353 (9%) | |
70+ Yrs | 776 (4%) | 8905 (6%) | 27352 (7%) | |
Median HH Income | $56,704 | $60,392 | $62,129 | |
Total Household Income | < 24K | 730 (11%) | 6972 (14%) | 18672 (14%) |
25-49K | 1880 (29%) | 12654 (25%) | 30681 (24%) | |
50-74K | 1673 (26%) | 11310 (22%) | 26350 (20%) | |
75-99K | 881 (13%) | 7640 (15%) | 19100 (15%) | |
100-199K | 1087 (17%) | 9918 (20%) | 26369 (20%) | |
200K+ | 60 (0%) | 946 (1%) | 4457 (3%) | |
Highest Education Level | No Diploma | 1441 | 14818 | 33196 |
Diploma or GED | 2735 | 28887 | 64429 | |
Some College | 2737 | 19670 | 49575 | |
Assoc. Degree | 893 | 8618 | 21903 | |
Bachelors Degree | 2047 | 14449 | 42875 | |
Higher Degree | 837 | 6766 | 22404 | |
Total Housing Units | 6,586 | 51,819 | 132,008 | |
--Owner-Occupied | 2,401 | 26,704 | 68,700 | |
--Renter-Occupied | 3,911 | 22,735 | 56,928 | |
Owner-Occupied Values | < 100K | 146 | 2342 | 3687 |
100-199K | 355 | 3634 | 9556 | |
200-299K | 677 | 9331 | 22885 | |
300-399K | 981 | 9356 | 22985 | |
400-499K | 212 | 1530 | 6473 | |
500K+ | 32 | 511 | 3114 | |
Total Working Age Population | 12,795 | 110,728 | 276,119 | |
In Work Force | 9,391 | 78,569 | 194,259 | |
Not In Work Force | 3,404 | 32,159 | 81,860 | |
Workforce Employed | 8,795 | 73,267 | 182,430 | |
Workforce Unemployed | 505 | 4,537 | 10,403 | |
Civlian Workforce | 9,300 | 77,804 | 192,833 | |
Military Workforce | 91 | 765 | 1,426 | |
Total Households | 6,312 | 49,440 | 125,628 | |
Family Households | 3,631 | 31,801 | 76,148 | |
Non-Family Households | 2,681 | 17,638 | 49,480 | |
Married Couple | 2,186 | 20,765 | 50,925 | |
Other Family | 1,445 | 11,036 | 25,223 | |
Married w/Child | 979 | 9,581 | 22,680 | |
Single Male w/Child | 222 | 1,543 | 3,364 | |
Single Female w/Child | 521 | 3,932 | 9,341 |
Population Change Last Two Decades - Plus Projection
2000 | % | 2010 | % | 2020 | % | 2030 | |
---|---|---|---|---|---|---|---|
Colorado | 4,301,261 | +17 | 5,029,196 | +16 | 5,838,181 | +15 | 6,733,658 |
Denver County | 554,636 | +8 | 600,158 | +23 | 738,611 | +12 | 827,681 |
Adams County | 363,857 | +21 | 441,603 | +20 | 530,680 | +21 | 642,318 |
Arapahoe County | 487,967 | +17 | 572,003 | +16 | 662,304 | +13 | 750,773 |
Total Working Age Population:
Total Households:
Total Working Age Population:
Total Households:
Total Working Age Population:
Total Households: