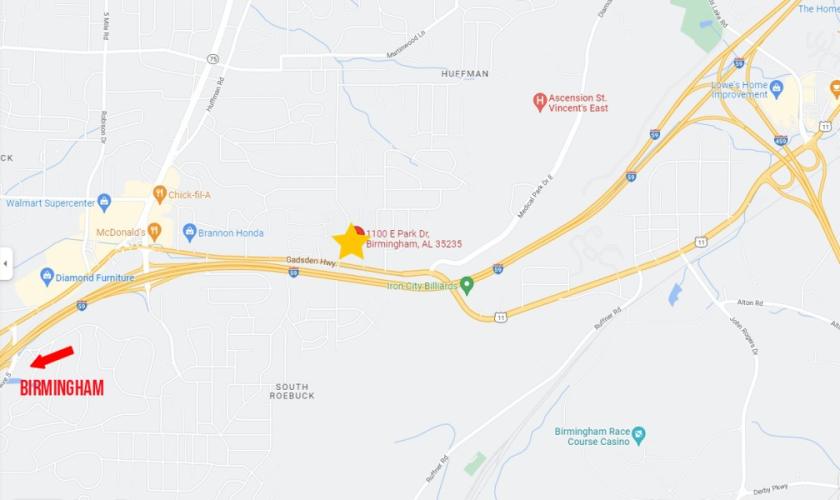
1-Mile | 3-Miles | 5-Miles | ||
---|---|---|---|---|
Total Population | 5,170 | 40,884 | 103,102 | |
Population Median Age | 40 | 38 | 38 | |
Population by Age | 0-9 Yrs | 733 (14%) | 5699 (13%) | 15232 (14%) |
10-19 Yrs | 622 (12%) | 5965 (14%) | 14273 (13%) | |
20-29 Yrs | 533 (10%) | 4712 (11%) | 11668 (11%) | |
30-39 Yrs | 448 (8%) | 4864 (11%) | 14069 (13%) | |
40-49 Yrs | 746 (14%) | 5752 (14%) | 12902 (12%) | |
50-59 Yrs | 1075 (20%) | 5431 (13%) | 12986 (12%) | |
60-69 Yrs | 518 (10%) | 4933 (12%) | 12011 (11%) | |
70+ Yrs | 494 (9%) | 3528 (8%) | 9959 (9%) | |
Median HH Income | $57,331 | $47,249 | $46,536 | |
Total Household Income | < 24K | 391 (19%) | 3700 (24%) | 10664 (26%) |
25-49K | 453 (22%) | 4465 (29%) | 10748 (26%) | |
50-74K | 492 (24%) | 3054 (19%) | 7620 (19%) | |
75-99K | 351 (17%) | 1947 (12%) | 4737 (11%) | |
100-199K | 279 (13%) | 1873 (12%) | 5342 (13%) | |
200K+ | 45 (2%) | 318 (2%) | 938 (2%) | |
Highest Education Level | No Diploma | 415 | 3535 | 7903 |
Diploma or GED | 851 | 7867 | 20459 | |
Some College | 1024 | 7564 | 17642 | |
Assoc. Degree | 437 | 2448 | 6458 | |
Bachelors Degree | 517 | 3524 | 10568 | |
Higher Degree | 392 | 2184 | 5587 | |
Total Housing Units | 2,205 | 17,800 | 46,495 | |
--Owner-Occupied | 1,376 | 9,379 | 24,327 | |
--Renter-Occupied | 636 | 5,978 | 15,722 | |
Owner-Occupied Values | < 100K | 433 | 3873 | 8715 |
100-199K | 735 | 4009 | 10653 | |
200-299K | 190 | 955 | 3029 | |
300-399K | 1 | 234 | 903 | |
400-499K | 1 | 77 | 395 | |
500K+ | 15 | 231 | 633 | |
Total Working Age Population | 4,073 | 31,164 | 78,551 | |
In Work Force | 2,690 | 19,111 | 47,122 | |
Not In Work Force | 1,383 | 12,052 | 31,429 | |
Workforce Employed | 2,499 | 17,455 | 42,970 | |
Workforce Unemployed | 182 | 1,630 | 4,125 | |
Civlian Workforce | 2,681 | 19,084 | 47,095 | |
Military Workforce | 10 | 27 | 27 | |
Total Households | 2,012 | 15,357 | 40,049 | |
Family Households | 1,161 | 9,726 | 25,148 | |
Non-Family Households | 852 | 5,631 | 14,901 | |
Married Couple | 760 | 5,663 | 14,540 | |
Other Family | 400 | 4,064 | 10,609 | |
Married w/Child | 211 | 1,924 | 5,200 | |
Single Male w/Child | 36 | 198 | 725 | |
Single Female w/Child | 94 | 1,605 | 5,052 |
Population Change Last Two Decades - Plus Projection
2000 | % | 2010 | % | 2020 | % | 2030 | |
---|---|---|---|---|---|---|---|
Alabama | 4,447,100 | +7 | 4,779,736 | +3 | 4,940,253 | +4 | 5,124,380 |
Jefferson County | 662,047 | -1 | 658,466 | +1 | 662,458 | 0 | 665,244 |
Total Working Age Population:
Total Households:
Total Working Age Population:
Total Households:
Total Working Age Population:
Total Households: