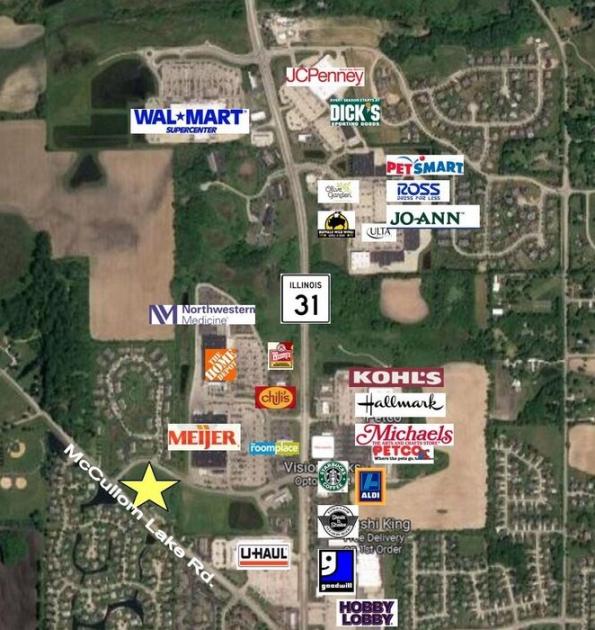
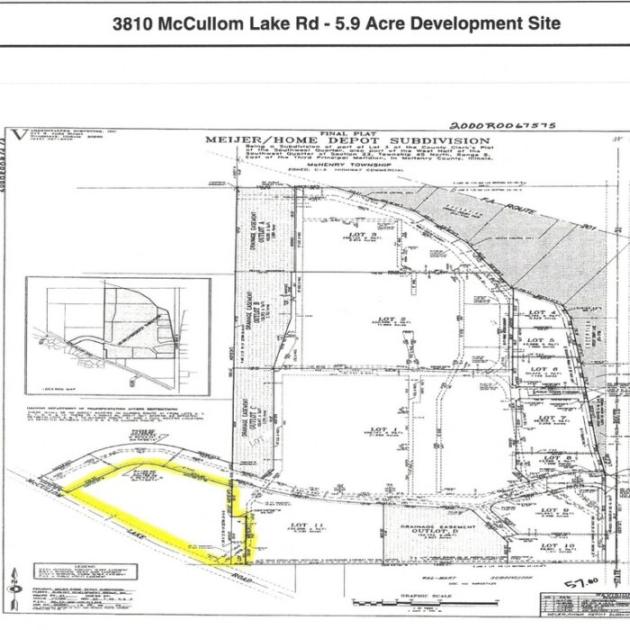
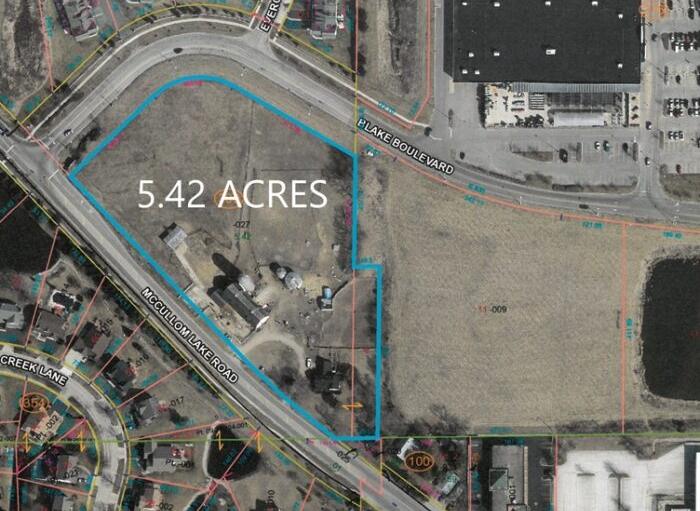
1-Mile | 3-Miles | 5-Miles | ||
---|---|---|---|---|
Total Population | 4,533 | 31,048 | 60,538 | |
Population Median Age | 39 | 40 | 40 | |
Population by Age | 0-9 Yrs | 462 (10%) | 3074 (9%) | 5974 (9%) |
10-19 Yrs | 661 (14%) | 4331 (13%) | 8325 (13%) | |
20-29 Yrs | 566 (12%) | 3684 (11%) | 7616 (12%) | |
30-39 Yrs | 533 (11%) | 3551 (11%) | 6998 (11%) | |
40-49 Yrs | 766 (16%) | 4321 (13%) | 8005 (13%) | |
50-59 Yrs | 695 (15%) | 5091 (16%) | 10622 (17%) | |
60-69 Yrs | 488 (10%) | 3787 (12%) | 7190 (11%) | |
70+ Yrs | 362 (7%) | 3210 (10%) | 5808 (9%) | |
Median HH Income | $68,191 | $74,338 | $79,150 | |
Total Household Income | < 24K | 306 (16%) | 1684 (13%) | 2691 (11%) |
25-49K | 359 (19%) | 2306 (18%) | 4274 (18%) | |
50-74K | 360 (19%) | 2191 (17%) | 4333 (18%) | |
75-99K | 198 (10%) | 1601 (13%) | 3033 (12%) | |
100-199K | 469 (25%) | 3471 (28%) | 7192 (30%) | |
200K+ | 130 (7%) | 993 (8%) | 2080 (8%) | |
Highest Education Level | No Diploma | 381 | 1870 | 2929 |
Diploma or GED | 1041 | 6953 | 13385 | |
Some College | 719 | 5011 | 9743 | |
Assoc. Degree | 214 | 1867 | 3914 | |
Bachelors Degree | 606 | 4487 | 9266 | |
Higher Degree | 220 | 1713 | 3311 | |
Total Housing Units | 1,879 | 12,753 | 24,997 | |
--Owner-Occupied | 1,270 | 9,499 | 18,249 | |
--Renter-Occupied | 553 | 2,746 | 5,353 | |
Owner-Occupied Values | < 100K | 124 | 769 | 1572 |
100-199K | 763 | 4290 | 7703 | |
200-299K | 270 | 2679 | 4832 | |
300-399K | 57 | 1069 | 2576 | |
400-499K | 26 | 392 | 950 | |
500K+ | 29 | 301 | 616 | |
Total Working Age Population | 3,636 | 25,204 | 49,270 | |
In Work Force | 2,640 | 17,133 | 34,279 | |
Not In Work Force | 996 | 8,071 | 14,990 | |
Workforce Employed | 2,580 | 16,423 | 32,799 | |
Workforce Unemployed | 60 | 710 | 1,466 | |
Civlian Workforce | 2,640 | 17,133 | 34,265 | |
Military Workforce | 0 | 0 | 14 | |
Total Households | 1,822 | 12,245 | 23,601 | |
Family Households | 1,185 | 8,207 | 16,100 | |
Non-Family Households | 637 | 4,039 | 7,502 | |
Married Couple | 877 | 6,584 | 12,901 | |
Other Family | 308 | 1,623 | 3,199 | |
Married w/Child | 370 | 2,524 | 4,753 | |
Single Male w/Child | 33 | 251 | 511 | |
Single Female w/Child | 120 | 595 | 1,225 |
Population Change Last Two Decades - Plus Projection
2000 | % | 2010 | % | 2020 | % | 2030 | |
---|---|---|---|---|---|---|---|
Illinois | 12,419,293 | +3 | 12,830,632 | +12 | 14,316,487 | +6 | 15,138,849 |
Lake County | 644,356 | +9 | 703,462 | +17 | 820,250 | +6 | 873,024 |
McHenry County | 260,077 | +19 | 308,760 | +32 | 407,931 | +9 | 443,398 |
Total Working Age Population:
Total Households:
Total Working Age Population:
Total Households:
Total Working Age Population:
Total Households: