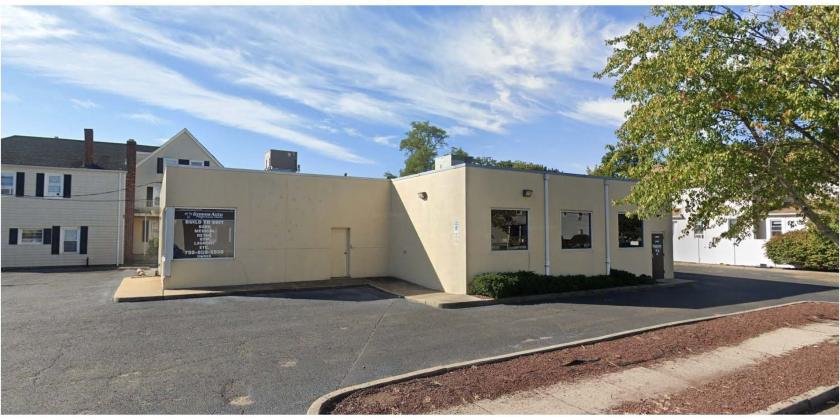
1-Mile | 3-Miles | 5-Miles | ||
---|---|---|---|---|
Total Population | 12,611 | 55,539 | 119,120 | |
Population Median Age | 40 | 41 | 41 | |
Population by Age | 0-9 Yrs | 1400 (11%) | 6271 (11%) | 14030 (11%) |
10-19 Yrs | 1487 (11%) | 7770 (13%) | 15522 (13%) | |
20-29 Yrs | 1414 (11%) | 4988 (8%) | 11993 (10%) | |
30-39 Yrs | 2008 (15%) | 6263 (11%) | 12702 (10%) | |
40-49 Yrs | 1663 (13%) | 8166 (14%) | 16102 (13%) | |
50-59 Yrs | 1631 (12%) | 7974 (14%) | 18420 (15%) | |
60-69 Yrs | 1493 (11%) | 7375 (13%) | 16502 (13%) | |
70+ Yrs | 1515 (12%) | 6732 (12%) | 13849 (11%) | |
Median HH Income | $77,910 | $117,113 | $114,622 | |
Total Household Income | < 24K | 936 (17%) | 2215 (10%) | 4816 (10%) |
25-49K | 1138 (20%) | 2605 (11%) | 5236 (11%) | |
50-74K | 610 (11%) | 2220 (10%) | 5413 (11%) | |
75-99K | 574 (10%) | 2255 (10%) | 4828 (10%) | |
100-199K | 1448 (26%) | 6617 (30%) | 13862 (30%) | |
200K+ | 796 (14%) | 5983 (27%) | 11592 (25%) | |
Highest Education Level | No Diploma | 987 | 1798 | 4417 |
Diploma or GED | 2370 | 7710 | 16808 | |
Some College | 1304 | 5616 | 12527 | |
Assoc. Degree | 731 | 2582 | 5965 | |
Bachelors Degree | 2116 | 12626 | 26253 | |
Higher Degree | 1741 | 8872 | 17688 | |
Total Housing Units | 5,641 | 22,869 | 48,263 | |
--Owner-Occupied | 2,875 | 16,800 | 34,839 | |
--Renter-Occupied | 2,627 | 5,095 | 10,909 | |
Owner-Occupied Values | < 100K | 74 | 404 | 992 |
100-199K | 473 | 1051 | 1531 | |
200-299K | 434 | 1495 | 2931 | |
300-399K | 601 | 2541 | 5916 | |
400-499K | 541 | 3016 | 6170 | |
500K+ | 752 | 8294 | 17299 | |
Total Working Age Population | 10,513 | 44,755 | 95,831 | |
In Work Force | 7,280 | 29,616 | 63,318 | |
Not In Work Force | 3,233 | 15,139 | 32,513 | |
Workforce Employed | 6,891 | 28,163 | 60,063 | |
Workforce Unemployed | 389 | 1,441 | 3,194 | |
Civlian Workforce | 7,280 | 29,604 | 63,258 | |
Military Workforce | 0 | 12 | 60 | |
Total Households | 5,501 | 21,895 | 45,748 | |
Family Households | 2,875 | 14,646 | 31,641 | |
Non-Family Households | 2,626 | 7,249 | 14,107 | |
Married Couple | 2,118 | 12,195 | 26,196 | |
Other Family | 757 | 2,450 | 5,446 | |
Married w/Child | 805 | 5,259 | 11,093 | |
Single Male w/Child | 163 | 353 | 599 | |
Single Female w/Child | 231 | 557 | 1,373 |
Population Change Last Two Decades - Plus Projection
2000 | % | 2010 | % | 2020 | % | 2030 | |
---|---|---|---|---|---|---|---|
New Jersey | 8,414,350 | +4 | 8,791,894 | +4 | 9,132,700 | +4 | 9,530,900 |
Monmouth County | 615,301 | +2 | 630,380 | 0 | 633,400 | +3 | 655,300 |
Total Working Age Population:
Total Households:
Total Working Age Population:
Total Households:
Total Working Age Population:
Total Households: