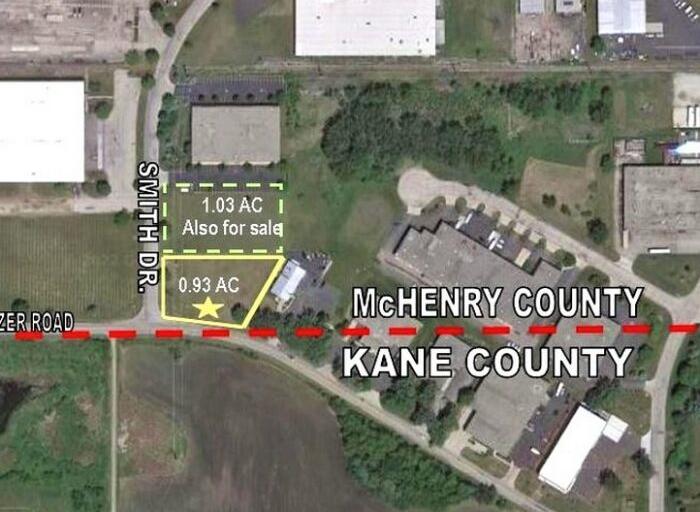
Commercial Land
Smith Drive-Lot 31 Huntley, IL 60142
Smith Drive-Lot 31 Huntley, IL 60142
Details & Description
Property Highlights
- • Topography Flat
- • Environmental Status TBD
- • Utilities Nearby
- • Sewer/Water City
- • Frontage Dimensions 326’
- • Zoning M1
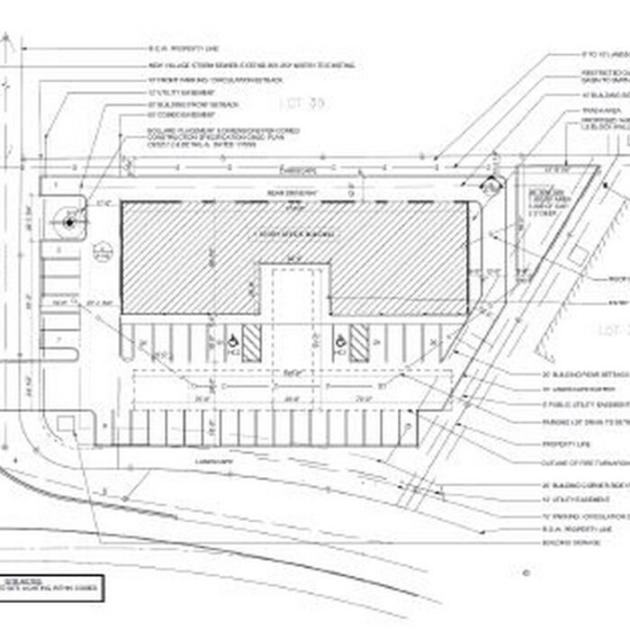
Additional Photos


Listing Agents

Kevin Kaplan
O: 847-854-2300
M: 309-261-0920
kevink@premiercommercialrealty.com
O: 847-854-2300
M: 309-261-0920
kevink@premiercommercialrealty.com

Bruce Kaplan
O: 847-854-2300
M: 847-507-1759
brucek@premiercommercialrealty.com
O: 847-854-2300
M: 847-507-1759
brucek@premiercommercialrealty.com
While we strive to provide the most accurate information, all listing information, and demographic data, is provided by third-parties. As such, MyEListing will not be responsible for the accuracy of the information. It is strongly recommended that you verify all information with the listing agent, and any relevant agencies, prior to making any decisions.