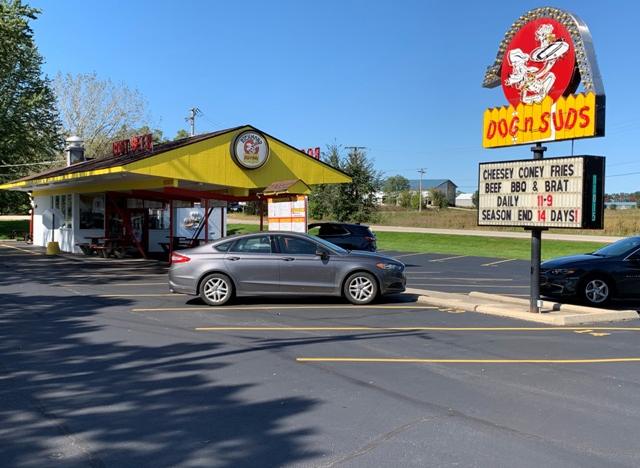
Retail Space
11015 U.S. 12 Richmond, IL 60071
11015 U.S. 12 Richmond, IL 60071
Details & Description
Property Highlights
- • Year Built 1962
- • Years in Business Current Owner since 2005
- • HVAC System GFA
- • Parking 44
- • Business Hours Seasonal
- • # of Employees 20 part time
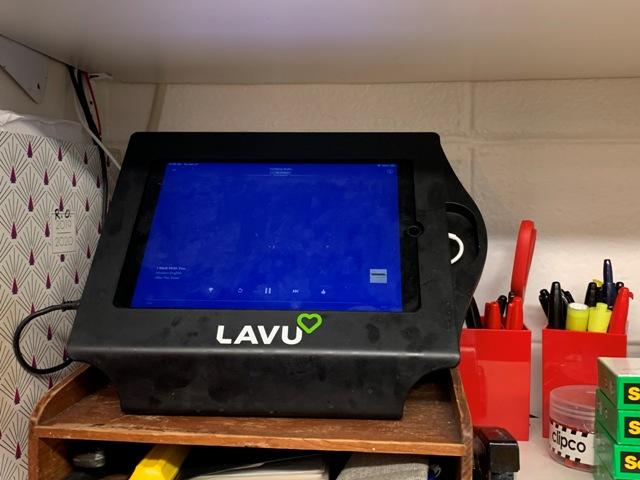
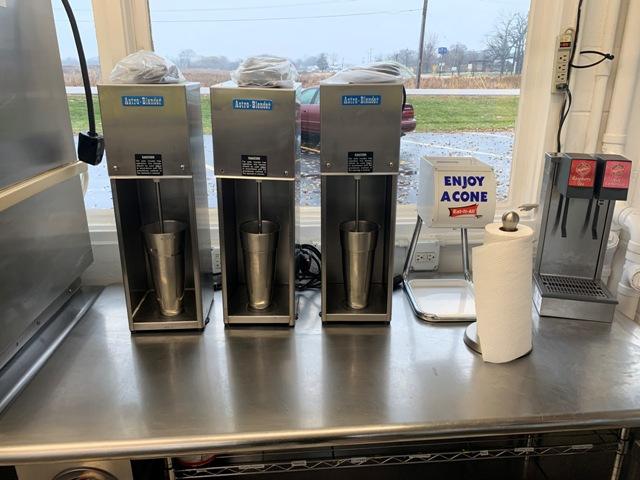
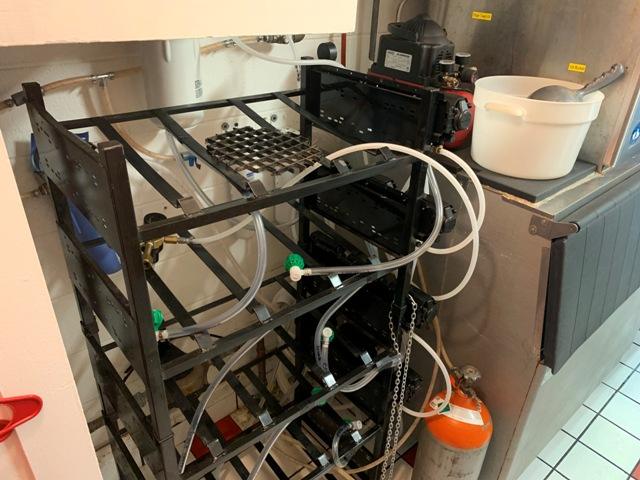
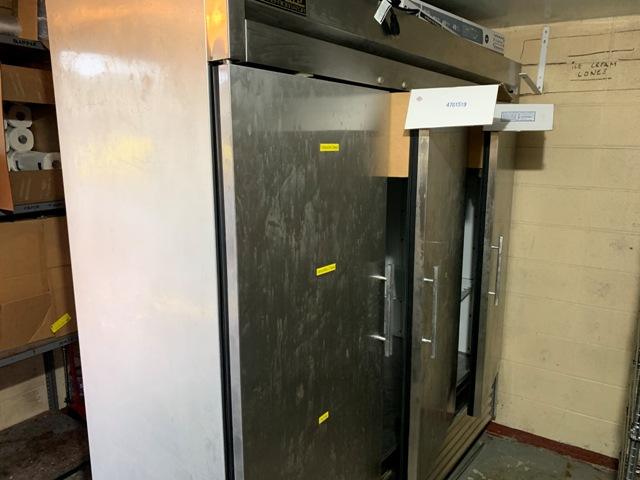
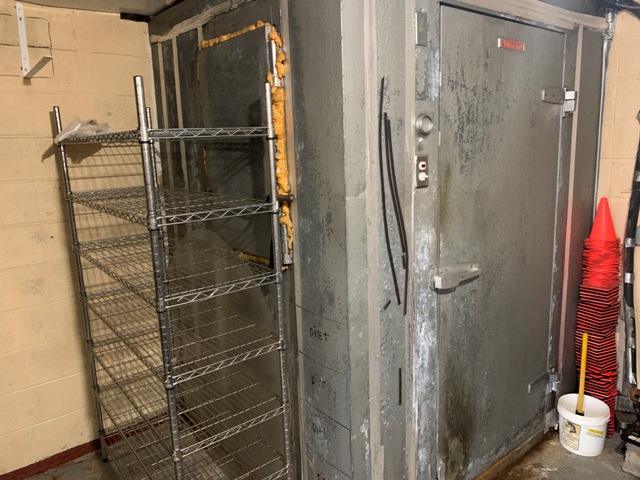
Additional Photos


Listing Agents

Kevin Kaplan
O: 847-854-2300
M: 309-261-0920
kevink@premiercommercialrealty.com
O: 847-854-2300
M: 309-261-0920
kevink@premiercommercialrealty.com

Bruce Kaplan
O: 847-854-2300
M: 847-507-1759
brucek@premiercommercialrealty.com
O: 847-854-2300
M: 847-507-1759
brucek@premiercommercialrealty.com
While we strive to provide the most accurate information, all listing information, and demographic data, is provided by third-parties. As such, MyEListing will not be responsible for the accuracy of the information. It is strongly recommended that you verify all information with the listing agent, and any relevant agencies, prior to making any decisions.