Industrial Properties
15 Morgan Street Crystal Lake, IL 60014
15 Morgan Street Crystal Lake, IL 60014

Details & Description
Property Highlights
- • HVAC System None
- • Electrical 100 amp
- • Sprinklers No
- • Washrooms None
- • Parking common
- • Floor Drains No
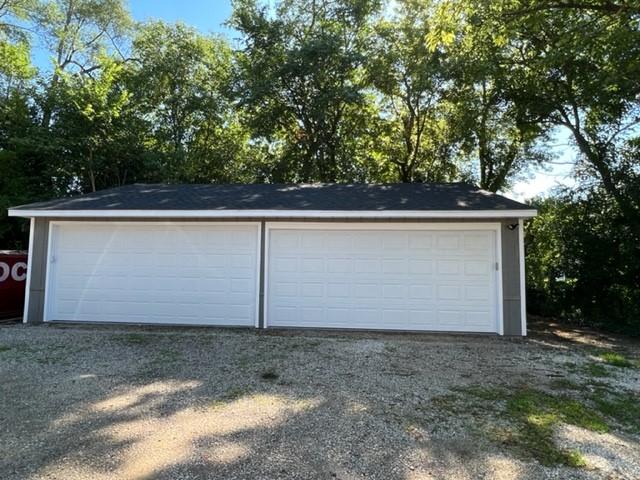
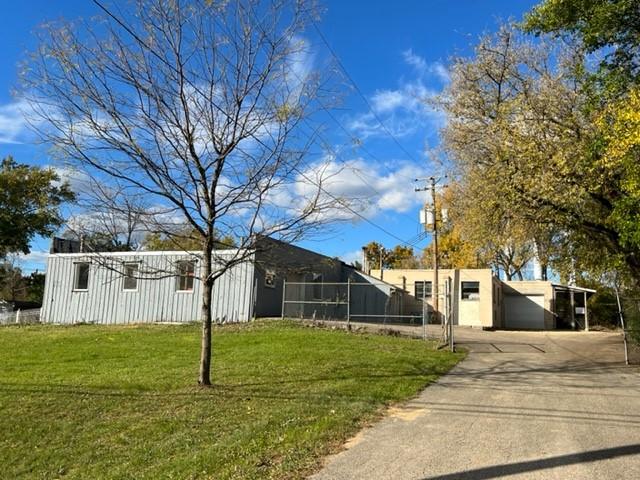
Additional Photos


Listing Agents

Heather Schweitzer
O: 847-854-2300
M: 815-236-9816
heathers@premiercommercialrealty.com
O: 847-854-2300
M: 815-236-9816
heathers@premiercommercialrealty.com
While we strive to provide the most accurate information, all listing information, and demographic data, is provided by third-parties. As such, MyEListing will not be responsible for the accuracy of the information. It is strongly recommended that you verify all information with the listing agent, and any relevant agencies, prior to making any decisions.


