Office Space
912 Northwest Highway- Suite 209 Fox River Grove, IL 60021
912 Northwest Highway- Suite 209 Fox River Grove, IL 60021

Details & Description
Property Highlights
- • Year Built 2004
- • HVAC System GFA / Central Air
- • Electrical 100 AMP
- • Elevator Yes
- • Sprinklers Yes
- • Washrooms Common
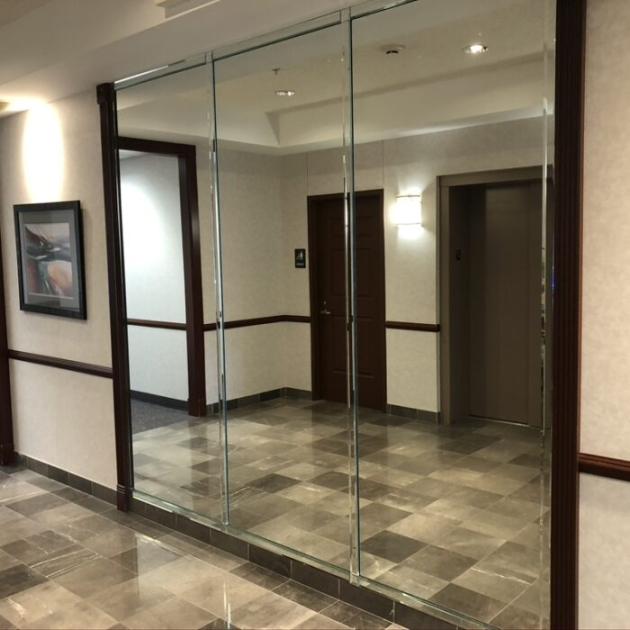
Additional Photos


Listing Agents

Bruce Kaplan
O: 847-854-2300
M: 847-507-1759
brucek@premiercommercialrealty.com
O: 847-854-2300
M: 847-507-1759
brucek@premiercommercialrealty.com

Kevin Kaplan
O: 847-854-2300
M: 309-261-0920
kevink@premiercommercialrealty.com
O: 847-854-2300
M: 309-261-0920
kevink@premiercommercialrealty.com
While we strive to provide the most accurate information, all listing information, and demographic data, is provided by third-parties. As such, MyEListing will not be responsible for the accuracy of the information. It is strongly recommended that you verify all information with the listing agent, and any relevant agencies, prior to making any decisions.


