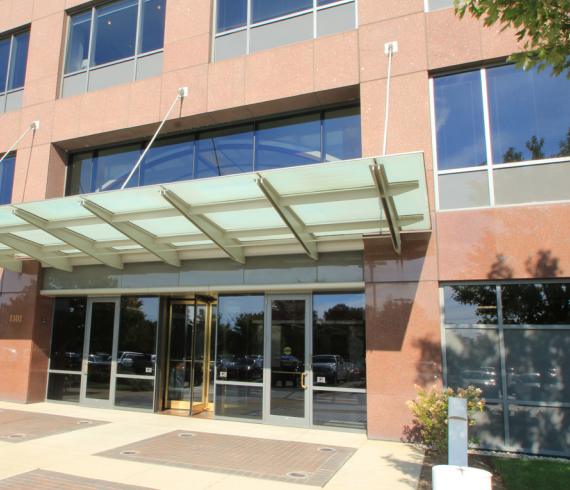
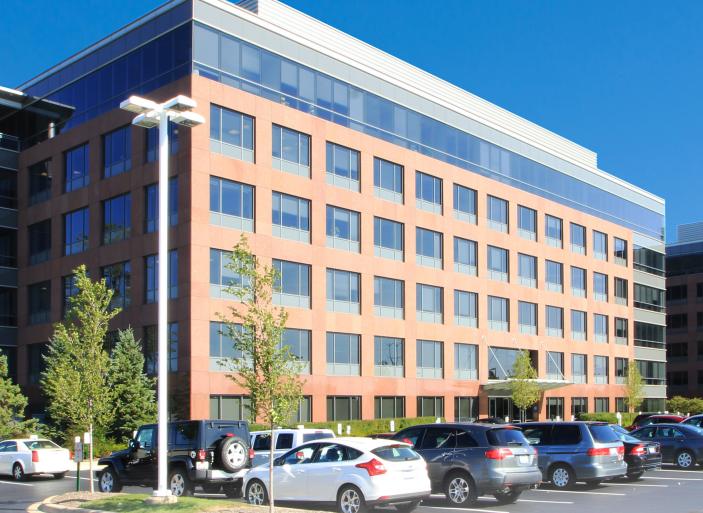
Office Space
1033 Skokie Boulevard Northbrook, IL 60062
1033 Skokie Boulevard Northbrook, IL 60062
Details & Description
Property Highlights
- • Tenants-only fitness center with showers
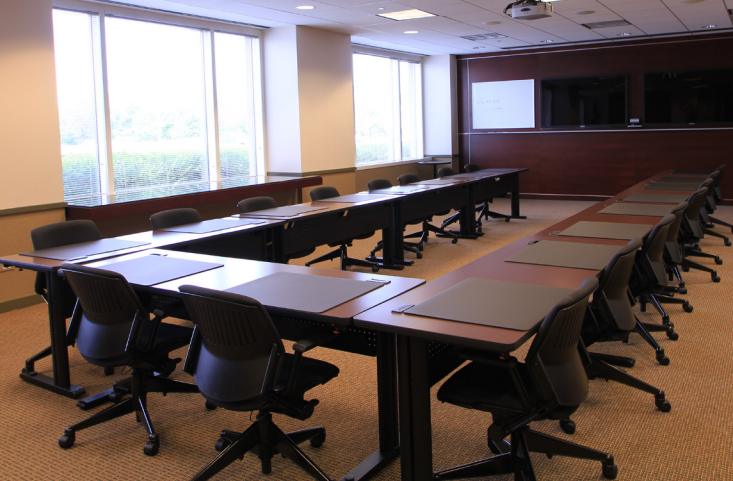
- • Conference room with A/V and seating for up to 40
- • Abundant surface parking/indoor executive parking
- • Easy access to I-94 via Dundee Road
- • Prime visibility with I-94 frontage
- • Easy commute to desirable residential communities
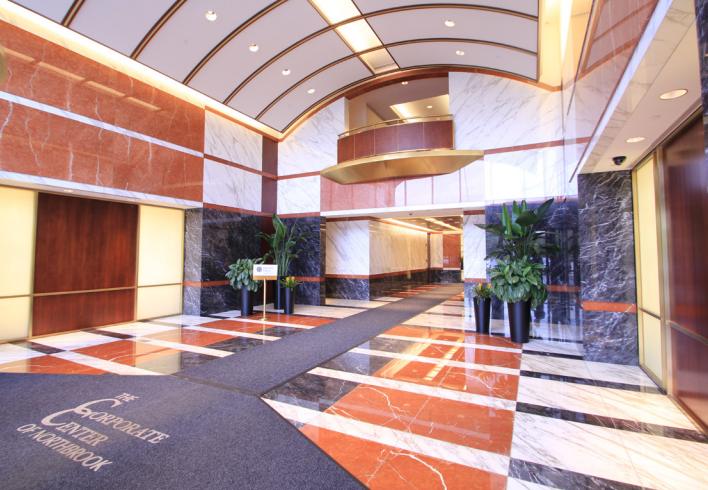
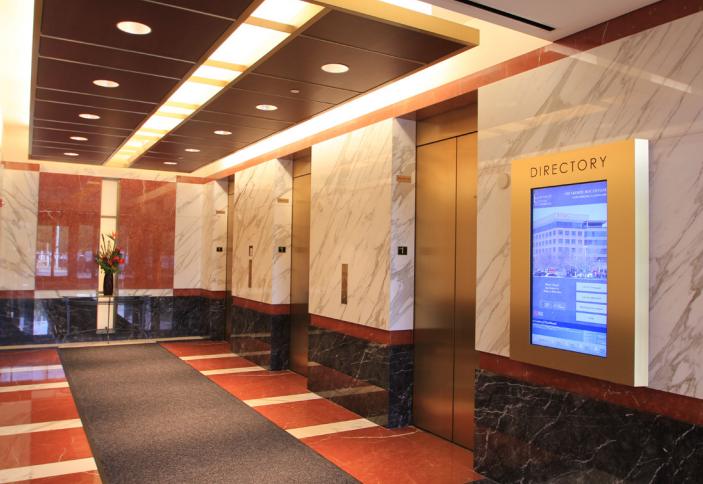
Additional Photos
Listing Agents

Doug Shehan
O: 773-458-1382
doug.shehan@jll.com
O: 773-458-1382
doug.shehan@jll.com

Julie Koelzer
O: 773-632-1049
julie.koelzer@jll.com
O: 773-632-1049
julie.koelzer@jll.com
While we strive to provide the most accurate information, all listing information, and demographic data, is provided by third-parties. As such, MyEListing will not be responsible for the accuracy of the information. It is strongly recommended that you verify all information with the listing agent, and any relevant agencies, prior to making any decisions.