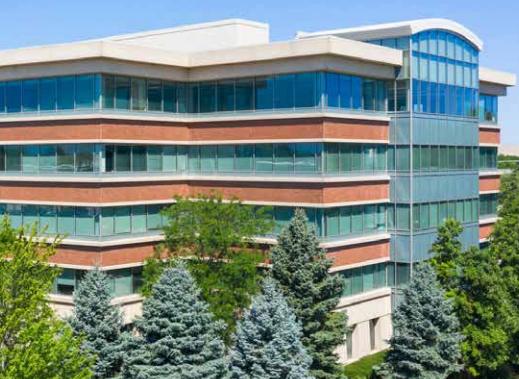
Office Space
485 Half Day Road Buffalo Grove, IL 60089
485 Half Day Road Buffalo Grove, IL 60089
Details & Description
Property Highlights
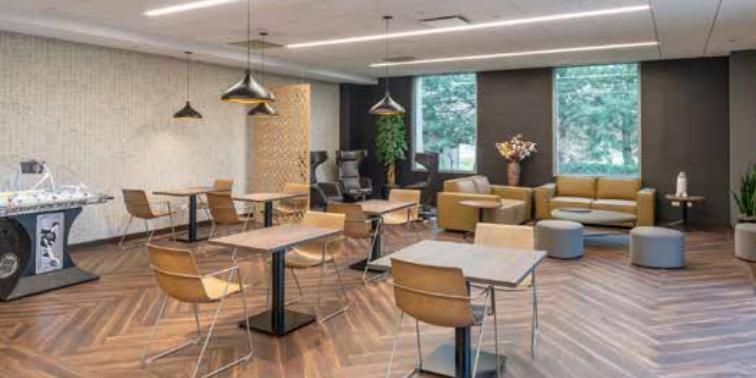
- • New conference and training center
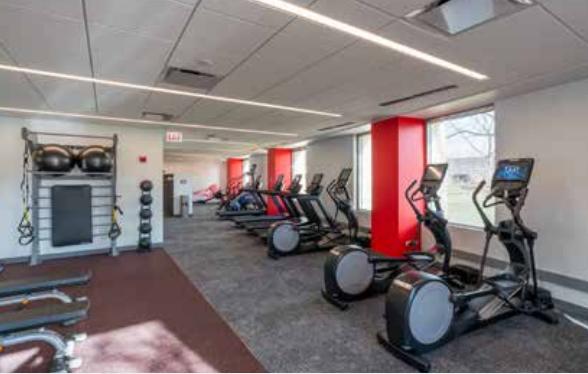
- • New fitness center
- • Outdoor patio with fire pit
- • 24/7, 365 keycard access
- • Abundant natural light
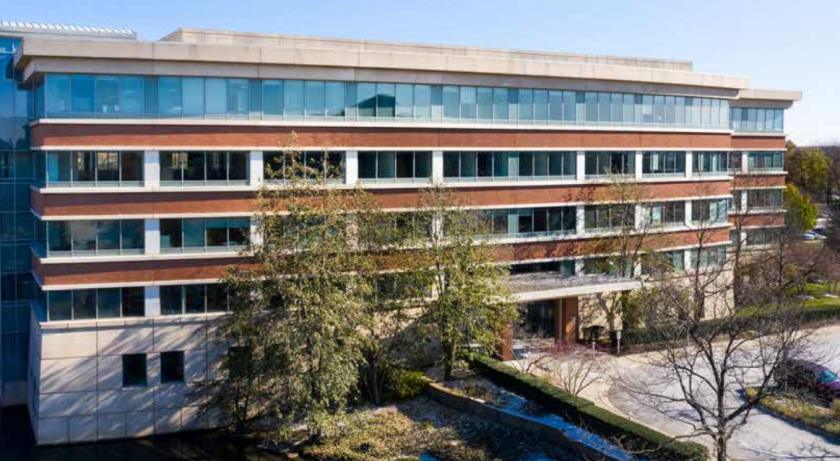
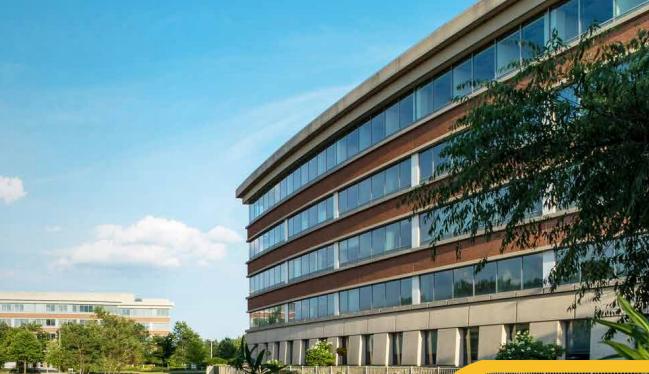
Additional Photos
Listing Agents

Chris Cummins
O: 773-458-1352
chris.cummins@jll.com
O: 773-458-1352
chris.cummins@jll.com

Julie Koelzer
O: 773-632-1049
julie.koelzer@jll.com
O: 773-632-1049
julie.koelzer@jll.com
While we strive to provide the most accurate information, all listing information, and demographic data, is provided by third-parties. As such, MyEListing will not be responsible for the accuracy of the information. It is strongly recommended that you verify all information with the listing agent, and any relevant agencies, prior to making any decisions.