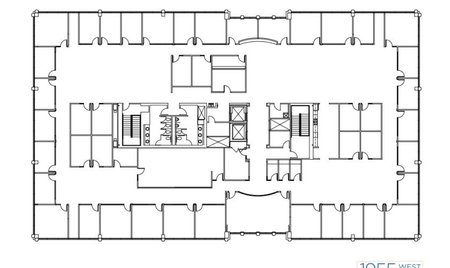
1-Mile | 3-Miles | 5-Miles | ||
---|---|---|---|---|
Total Population | 1,959 | 22,163 | 112,035 | |
Population Median Age | 46 | 46 | 40 | |
Population by Age | 0-9 Yrs | 218 (11%) | 2013 (9%) | 12821 (11%) |
10-19 Yrs | 219 (11%) | 2895 (13%) | 16583 (14%) | |
20-29 Yrs | 168 (8%) | 1863 (8%) | 12972 (11%) | |
30-39 Yrs | 133 (6%) | 1810 (8%) | 11798 (10%) | |
40-49 Yrs | 214 (10%) | 2389 (10%) | 13899 (12%) | |
50-59 Yrs | 291 (14%) | 3361 (15%) | 16340 (14%) | |
60-69 Yrs | 338 (17%) | 3477 (15%) | 13174 (11%) | |
70+ Yrs | 377 (19%) | 4355 (19%) | 14447 (12%) | |
Median HH Income | $178,034 | $149,113 | $122,674 | |
Total Household Income | < 24K | 38 (5%) | 753 (8%) | 4270 (10%) |
25-49K | 54 (7%) | 879 (10%) | 4228 (10%) | |
50-74K | 68 (9%) | 999 (11%) | 4780 (11%) | |
75-99K | 41 (5%) | 645 (7%) | 4319 (10%) | |
100-199K | 195 (28%) | 2171 (24%) | 11470 (27%) | |
200K+ | 298 (43%) | 3299 (37%) | 12619 (30%) | |
Highest Education Level | No Diploma | 35 | 458 | 2824 |
Diploma or GED | 147 | 1702 | 7568 | |
Some College | 146 | 1732 | 9688 | |
Assoc. Degree | 34 | 626 | 3496 | |
Bachelors Degree | 475 | 6095 | 27118 | |
Higher Degree | 538 | 5528 | 24759 | |
Total Housing Units | 759 | 9,603 | 44,208 | |
--Owner-Occupied | 606 | 6,851 | 30,419 | |
--Renter-Occupied | 86 | 1,896 | 11,267 | |
Owner-Occupied Values | < 100K | 19 | 183 | 740 |
100-199K | 7 | 249 | 2123 | |
200-299K | 12 | 378 | 3171 | |
300-399K | 30 | 814 | 5082 | |
400-499K | 33 | 628 | 4305 | |
500K+ | 505 | 4599 | 14999 | |
Total Working Age Population | 1,608 | 18,382 | 89,589 | |
In Work Force | 780 | 9,758 | 55,833 | |
Not In Work Force | 828 | 8,624 | 33,756 | |
Workforce Employed | 753 | 9,437 | 52,614 | |
Workforce Unemployed | 27 | 297 | 1,935 | |
Civlian Workforce | 780 | 9,734 | 54,548 | |
Military Workforce | 0 | 24 | 1,285 | |
Total Households | 693 | 8,747 | 41,687 | |
Family Households | 556 | 6,063 | 29,564 | |
Non-Family Households | 137 | 2,685 | 12,122 | |
Married Couple | 520 | 5,546 | 25,791 | |
Other Family | 36 | 517 | 3,773 | |
Married w/Child | 179 | 2,036 | 11,642 | |
Single Male w/Child | 8 | 52 | 455 | |
Single Female w/Child | 9 | 150 | 1,478 |
Population Change Last Two Decades - Plus Projection
2000 | % | 2010 | % | 2020 | % | 2030 | |
---|---|---|---|---|---|---|---|
Illinois | 12,419,293 | +3 | 12,830,632 | +12 | 14,316,487 | +6 | 15,138,849 |
Lake County | 644,356 | +9 | 703,462 | +17 | 820,250 | +6 | 873,024 |
Total Working Age Population:
Total Households:
Total Working Age Population:
Total Households:
Total Working Age Population:
Total Households: