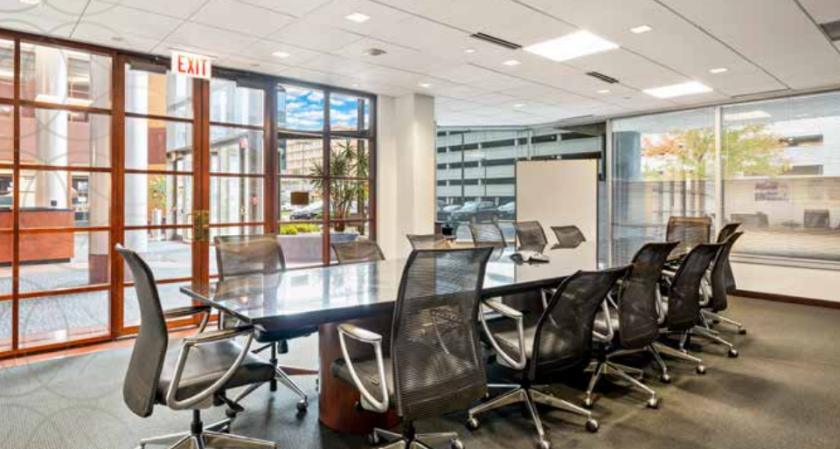
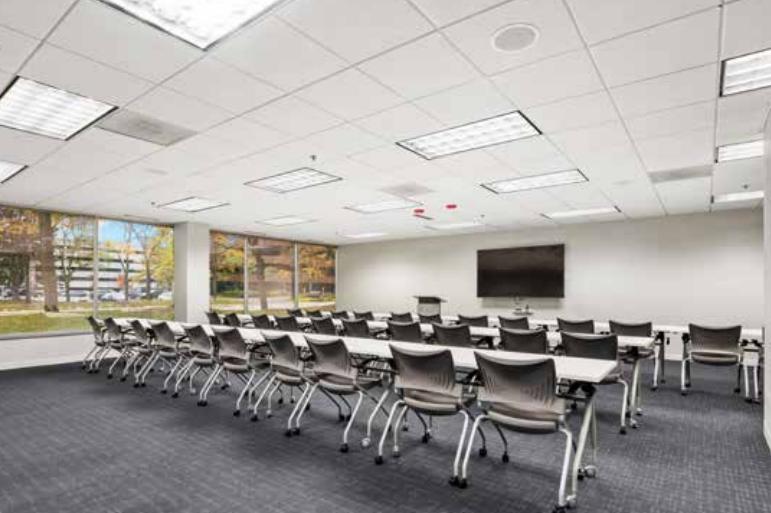
Office Space
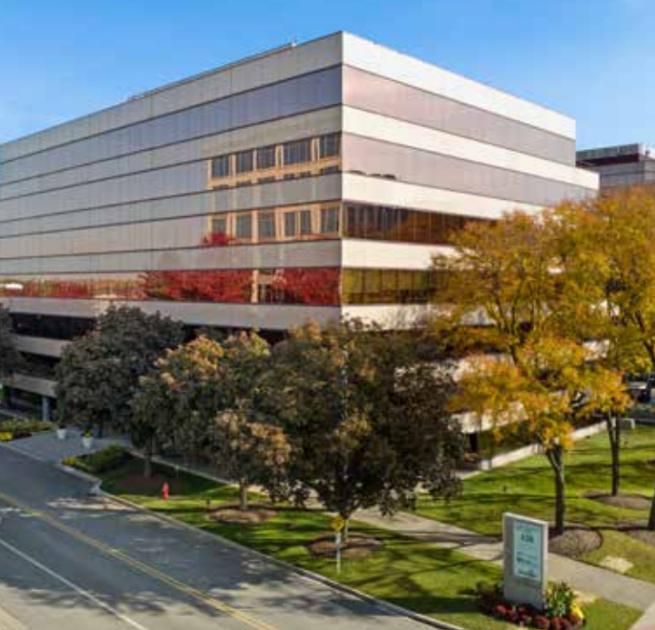
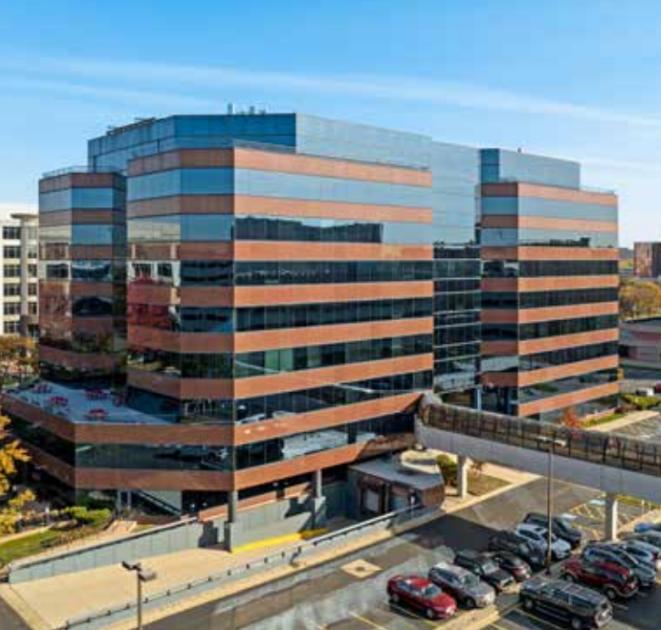
5600 North River Road Rosemont, IL 60018
5600 North River Road Rosemont, IL 60018

Details & Description
Property Highlights
- • 3 to 1,000 SF parking ratio
- • On-site management
- • 5-7 minute walk to CTA Blue Line
- • Covered garage and surface parking
- • Covered garage and surface parking
- • Free shuttle service to/from CTA Blue Line
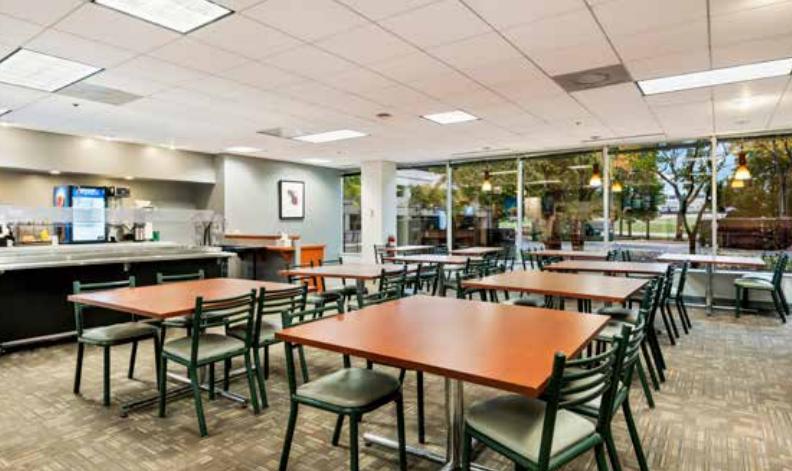
Additional Photos

Listing Agents

Doug Shehan
O: 773-458-1382
doug.shehan@jll.com
O: 773-458-1382
doug.shehan@jll.com

Allyson Birchmeier
O: 773-632-2511
allyson.birchmeier@jll.com
O: 773-632-2511
allyson.birchmeier@jll.com
While we strive to provide the most accurate information, all listing information, and demographic data, is provided by third-parties. As such, MyEListing will not be responsible for the accuracy of the information. It is strongly recommended that you verify all information with the listing agent, and any relevant agencies, prior to making any decisions.