Specialty Real Estate
3525 McCarty Lane Lafayette, IN 47905
3525 McCarty Lane Lafayette, IN 47905

Details & Description
Property Highlights
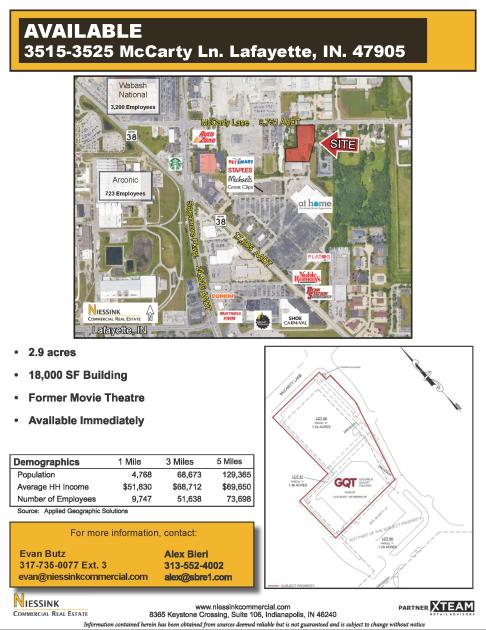
• Old Movie Theater
• Large Parking Lot
Listing Agents

Jalen Frye
jalen@niessinkcommercial.com
jalen@niessinkcommercial.com
While we strive to provide the most accurate information, all listing information, and demographic data, is provided by third-parties. As such, MyEListing will not be responsible for the accuracy of the information. It is strongly recommended that you verify all information with the listing agent, and any relevant agencies, prior to making any decisions.