Industrial Properties
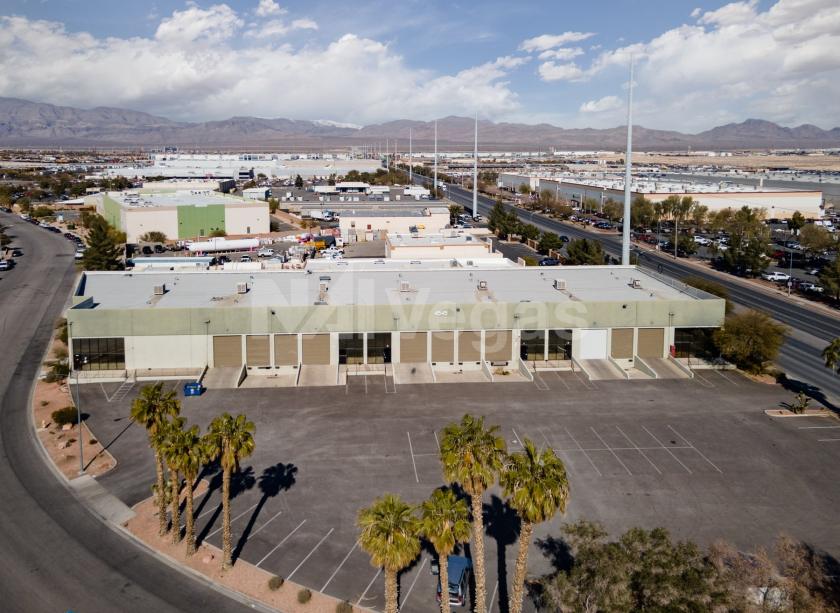
4545 North Lamb Boulevard Las Vegas, NV 89115
4545 North Lamb Boulevard Las Vegas, NV 89115
Details & Description
Property Highlights
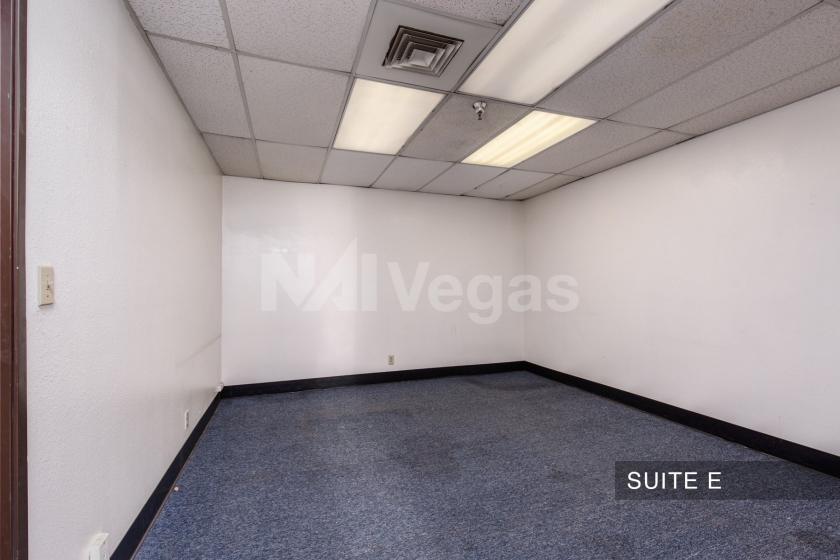
- • ±472 SF Office
- • Reception, Office, Restroom
- • Two (2) Dock High Doors (10 x 14)
- • 21’ Clear Height
- • 200Amps, Single-Phase Power
- • HVAC (EVAP) Maintenance Included in CAMs
Additional Photos


Listing Agents

Bryan Houser
O: 702-277-9207
M: 702-534-1714
bhouser@naiexcel.com
O: 702-277-9207
M: 702-534-1714
bhouser@naiexcel.com
While we strive to provide the most accurate information, all listing information, and demographic data, is provided by third-parties. As such, MyEListing will not be responsible for the accuracy of the information. It is strongly recommended that you verify all information with the listing agent, and any relevant agencies, prior to making any decisions.