Office Space
150 North Martingale Road Schaumburg, IL 60173
150 North Martingale Road Schaumburg, IL 60173

Details & Description
Property Highlights
- • All-new WiFi lounge
- • New energy-efficient HVAC system
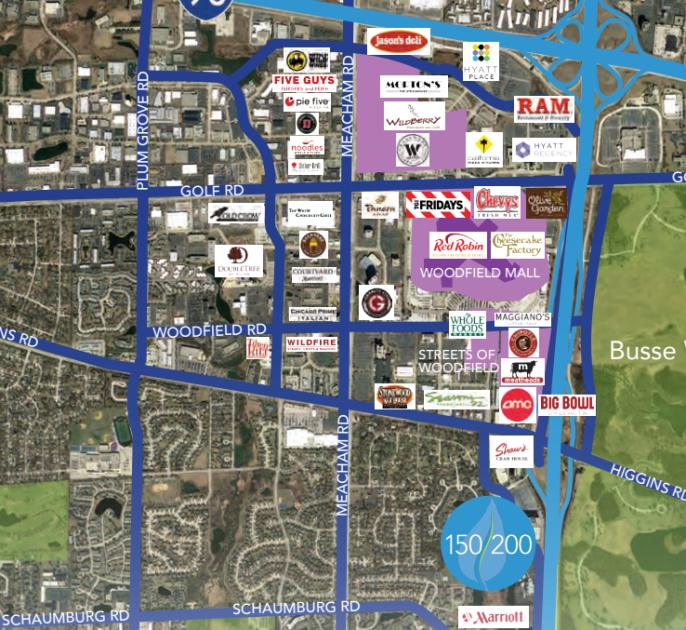
- • Rooftop signage with prime I-290 visibility
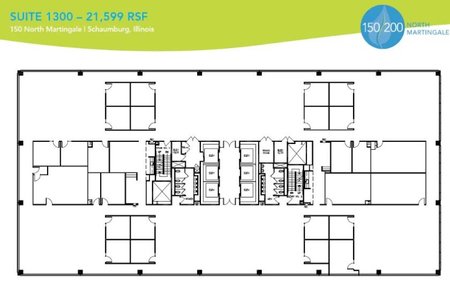
- • Flexible 21,600-square-feet floorplates
- • Main lobby reception potential
Additional Photos


Listing Agents

Doug Shehan
O: 773-458-1382
doug.shehan@jll.com
O: 773-458-1382
doug.shehan@jll.com

Rick Benoy
O: 773-304-4105
rick.benoy@jll.com
O: 773-304-4105
rick.benoy@jll.com
While we strive to provide the most accurate information, all listing information, and demographic data, is provided by third-parties. As such, MyEListing will not be responsible for the accuracy of the information. It is strongly recommended that you verify all information with the listing agent, and any relevant agencies, prior to making any decisions.