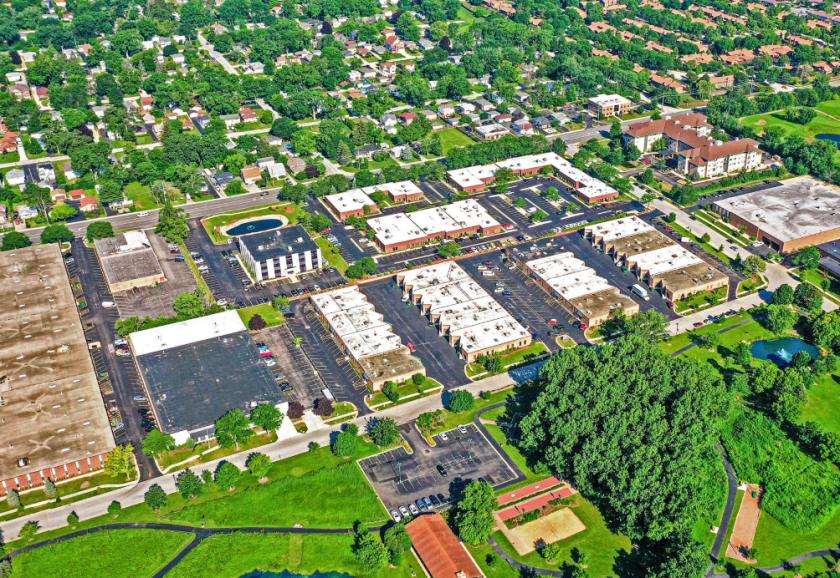
Flex-Office-Warehouse
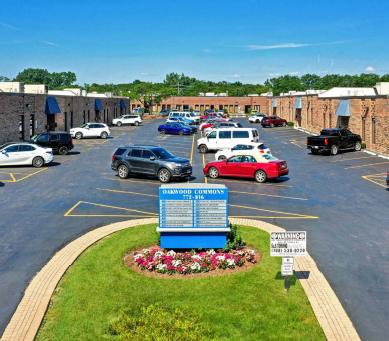
756 - 816 Burr Oak Dr Westmont, IL 60559
756 - 816 Burr Oak Dr Westmont, IL 60559
Details & Description
Property Highlights
- • Dock doors in every unit
- • 12ft clear height in warehouse
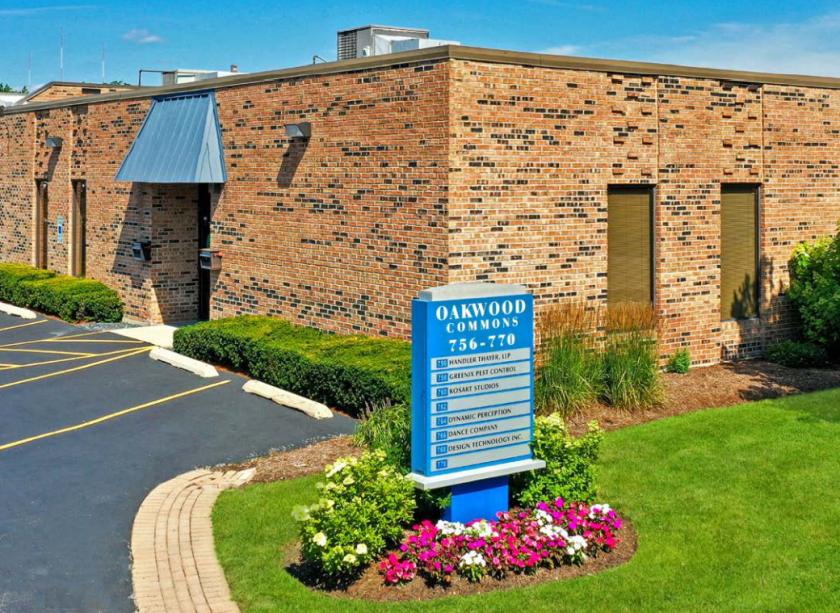
- • Private entrance to tenant space
Listing Agents

Allyson Birchmeier
O: 773-632-2511
allyson.birchmeier@jll.com
O: 773-632-2511
allyson.birchmeier@jll.com

Dan Svachula
dan.svachula@jll.com
dan.svachula@jll.com
While we strive to provide the most accurate information, all listing information, and demographic data, is provided by third-parties. As such, MyEListing will not be responsible for the accuracy of the information. It is strongly recommended that you verify all information with the listing agent, and any relevant agencies, prior to making any decisions.