Office Space
61st St and Sycamore Ave Sioux Falls, SD 57108
61st St and Sycamore Ave Sioux Falls, SD 57108

Details & Description
Property Highlights
- • Year Built 2022
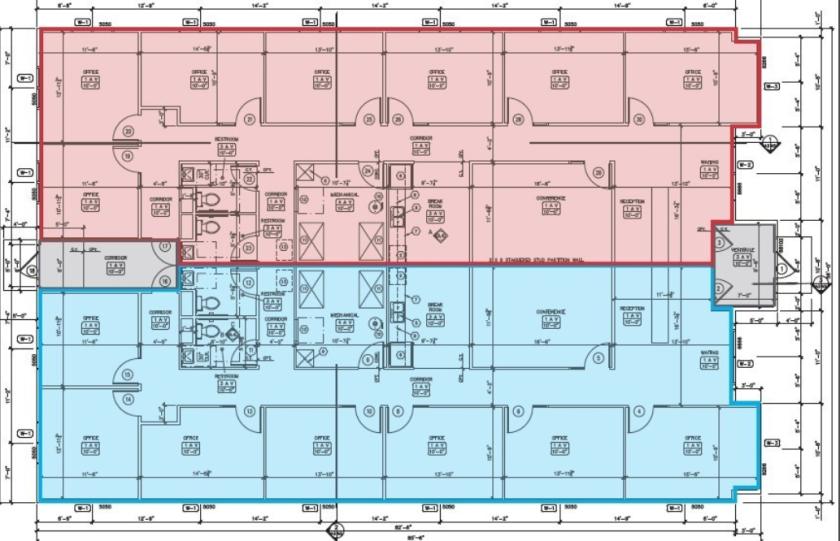
- • Two separate suites possible
- • Separate entrances possible
- • Monument signage
- • Currently under construction
- • Shell to be complete December 1, 2022
Additional Photos


Listing Agents

Craig Hagen
O: 605-357-7100
M: 605-310-4227
chagen@naisiouxfalls.com
O: 605-357-7100
M: 605-310-4227
chagen@naisiouxfalls.com
While we strive to provide the most accurate information, all listing information, and demographic data, is provided by third-parties. As such, MyEListing will not be responsible for the accuracy of the information. It is strongly recommended that you verify all information with the listing agent, and any relevant agencies, prior to making any decisions.


