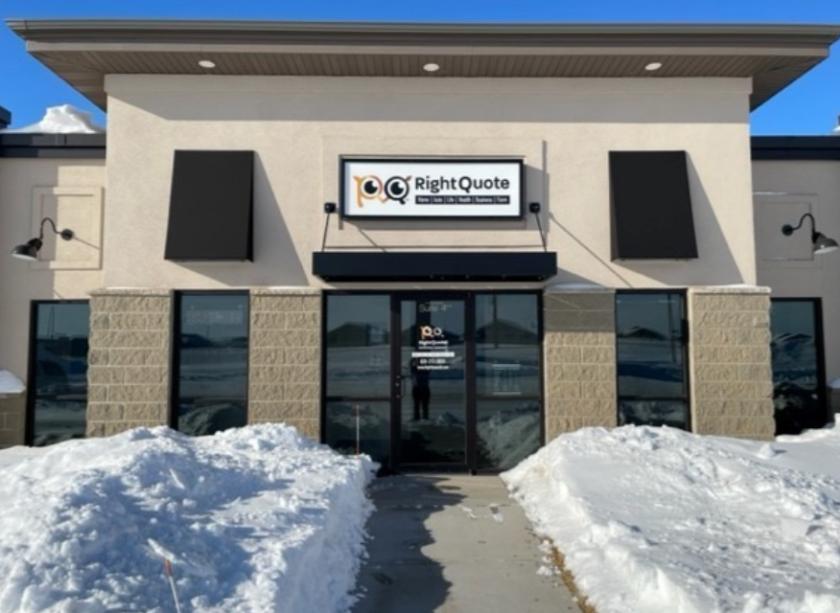
Office Space
225 North Cliff Avenue Harrisburg, SD 57032
225 North Cliff Avenue Harrisburg, SD 57032
Details & Description
Property Highlights
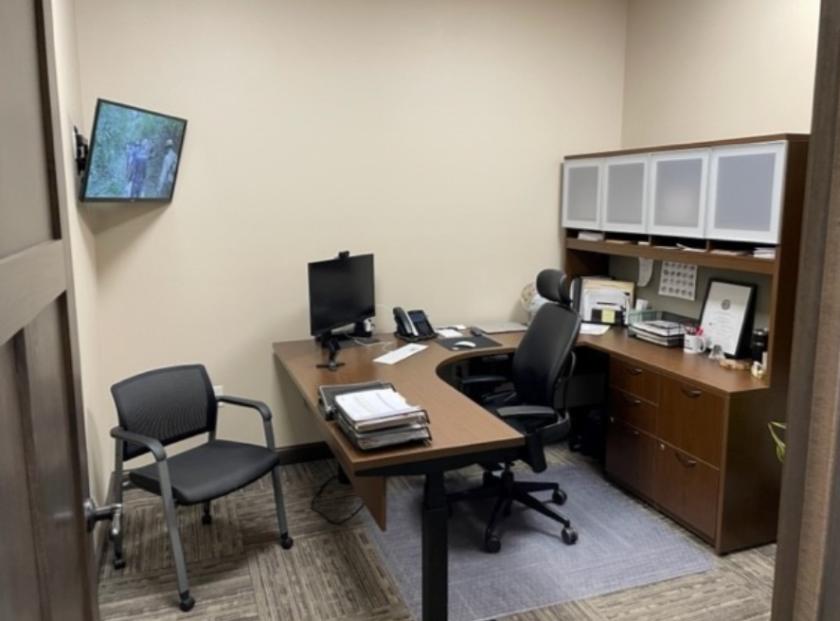
- • 2 offices and 1 work station available immediately
- • Partially furnished
- • Lease expires 4/30/2026
Additional Photos


Listing Agents

Gregg Brown
O: 605-444-7103
M: 605-906-0394
gbrown@naisiouxfalls.com
O: 605-444-7103
M: 605-906-0394
gbrown@naisiouxfalls.com
While we strive to provide the most accurate information, all listing information, and demographic data, is provided by third-parties. As such, MyEListing will not be responsible for the accuracy of the information. It is strongly recommended that you verify all information with the listing agent, and any relevant agencies, prior to making any decisions.