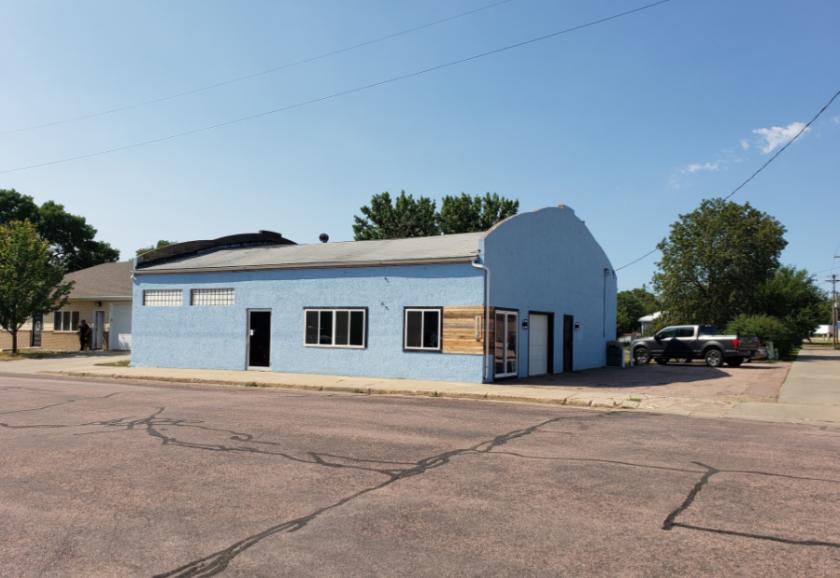
Industrial Properties
112 West 2nd Avenue Lennox, SD 57039
112 West 2nd Avenue Lennox, SD 57039

Details & Description
Property Highlights
- • Year Built 1930
- • One overhead door
- • Paved parking lot
- • Recently tuck-pointed
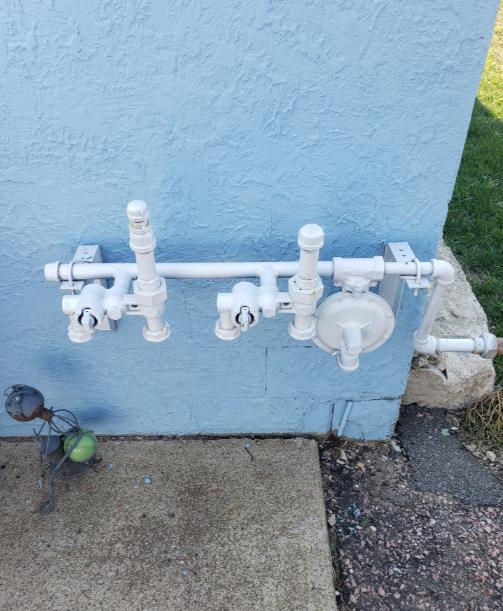
Additional Photos

Listing Agents

Michael Martin
O: 605-444-7105
M: 605-261-2777
mmartin@naisiouxfalls.com
O: 605-444-7105
M: 605-261-2777
mmartin@naisiouxfalls.com
While we strive to provide the most accurate information, all listing information, and demographic data, is provided by third-parties. As such, MyEListing will not be responsible for the accuracy of the information. It is strongly recommended that you verify all information with the listing agent, and any relevant agencies, prior to making any decisions.


