Office Space
629 South Minnesota Avenue Sioux Falls, SD 57104
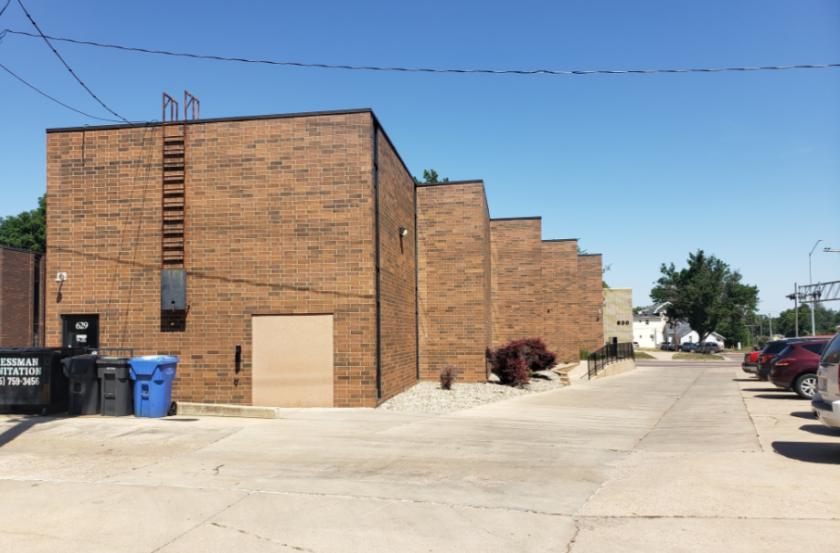
629 South Minnesota Avenue Sioux Falls, SD 57104

Details & Description
Property Highlights
- • Office building in the heart of Sioux Falls
- • Building size: 14,562 sq. ft. – three floors
- • Year built: 1983
- • Monument signs on Minnesota Avenue
- • Additional land to expand parking
- • Significantly below replacement cost
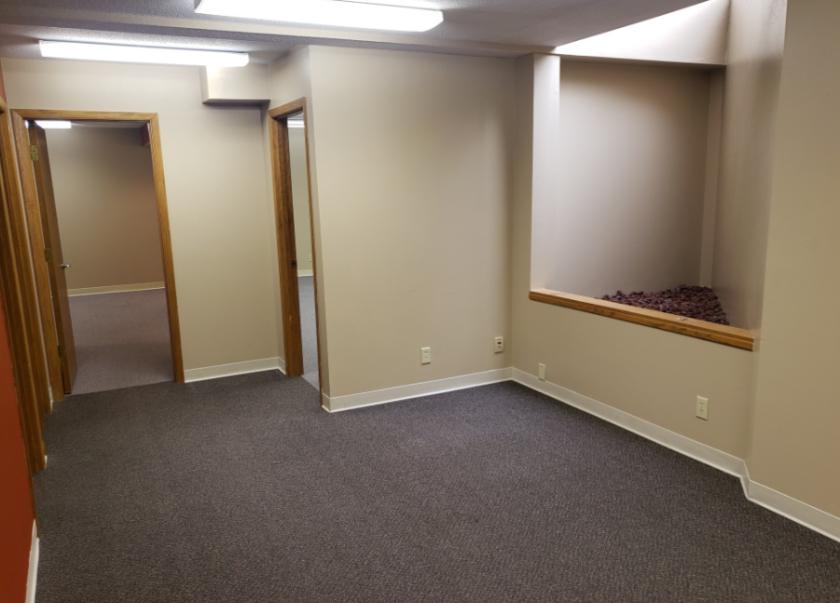
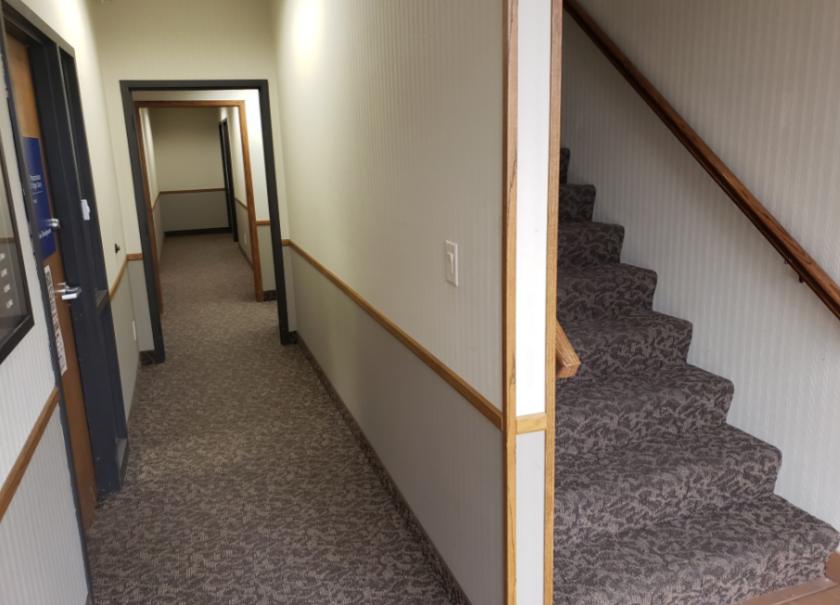
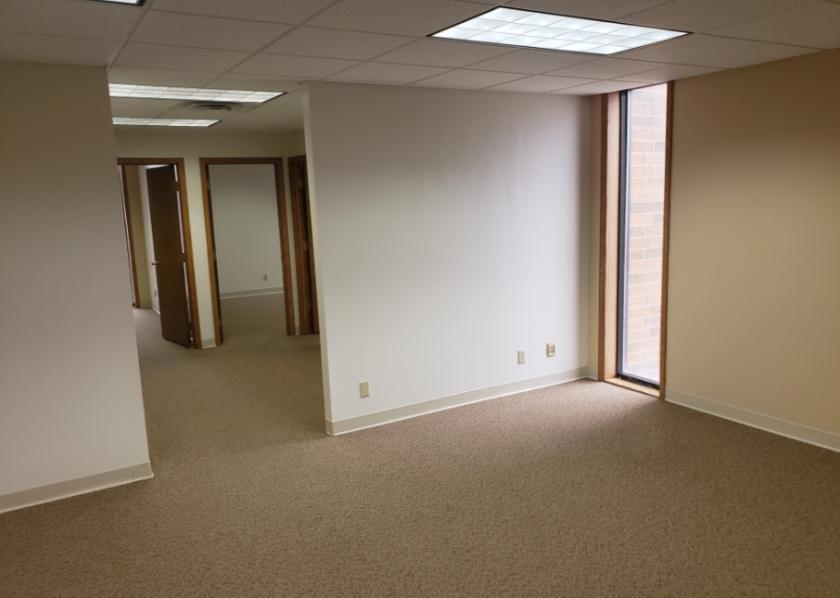
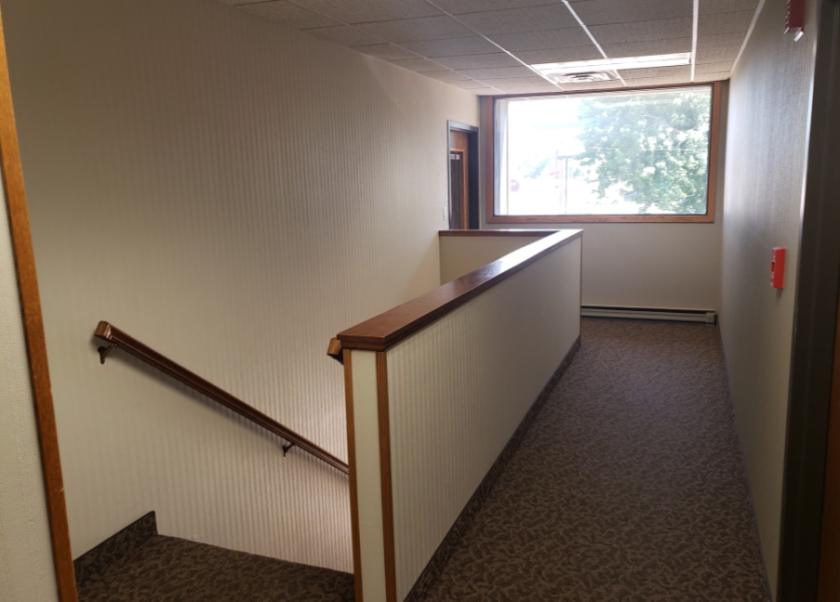
Additional Photos


Listing Agents

Michael Martin
O: 605-444-7105
M: 605-261-2777
mmartin@naisiouxfalls.com
O: 605-444-7105
M: 605-261-2777
mmartin@naisiouxfalls.com

Troy Fawcett
O: 605-357-7100
M: 605-321-2199
tfawcett@naisiouxfalls.com
O: 605-357-7100
M: 605-321-2199
tfawcett@naisiouxfalls.com
While we strive to provide the most accurate information, all listing information, and demographic data, is provided by third-parties. As such, MyEListing will not be responsible for the accuracy of the information. It is strongly recommended that you verify all information with the listing agent, and any relevant agencies, prior to making any decisions.