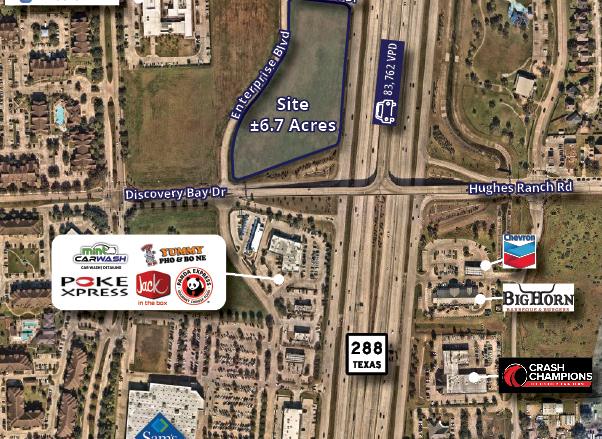
1-Mile | 3-Miles | 5-Miles | ||
---|---|---|---|---|
Total Population | 11,883 | 78,115 | 187,691 | |
Population Median Age | 35 | 34 | 34 | |
Population by Age | 0-9 Yrs | 1682 (14%) | 13240 (16%) | 29352 (15%) |
10-19 Yrs | 1532 (12%) | 11347 (14%) | 28212 (15%) | |
20-29 Yrs | 1898 (15%) | 7594 (9%) | 22365 (11%) | |
30-39 Yrs | 2055 (17%) | 14679 (18%) | 32367 (17%) | |
40-49 Yrs | 1932 (16%) | 12512 (16%) | 27681 (14%) | |
50-59 Yrs | 1058 (8%) | 8893 (11%) | 21169 (11%) | |
60-69 Yrs | 684 (5%) | 5104 (6%) | 15602 (8%) | |
70+ Yrs | 1041 (8%) | 4748 (6%) | 10943 (5%) | |
Median HH Income | $81,853 | $98,679 | $81,976 | |
Total Household Income | < 24K | 607 (13%) | 1781 (6%) | 7178 (11%) |
25-49K | 661 (14%) | 3715 (13%) | 10773 (17%) | |
50-74K | 773 (16%) | 3788 (14%) | 10551 (17%) | |
75-99K | 1065 (22%) | 4421 (16%) | 8630 (13%) | |
100-199K | 1122 (24%) | 8828 (32%) | 18263 (29%) | |
200K+ | 438 (9%) | 4410 (16%) | 6426 (10%) | |
Highest Education Level | No Diploma | 601 | 3259 | 14504 |
Diploma or GED | 925 | 5839 | 23940 | |
Some College | 1547 | 8390 | 24800 | |
Assoc. Degree | 503 | 4049 | 9207 | |
Bachelors Degree | 2618 | 16498 | 28340 | |
Higher Degree | 1728 | 12175 | 19352 | |
Total Housing Units | 5,271 | 28,605 | 65,646 | |
--Owner-Occupied | 2,487 | 19,428 | 44,469 | |
--Renter-Occupied | 2,179 | 7,515 | 17,352 | |
Owner-Occupied Values | < 100K | 156 | 865 | 8783 |
100-199K | 727 | 3547 | 11035 | |
200-299K | 959 | 8371 | 14490 | |
300-399K | 368 | 4106 | 6490 | |
400-499K | 248 | 1834 | 2418 | |
500K+ | 28 | 705 | 1252 | |
Total Working Age Population | 8,957 | 57,990 | 141,114 | |
In Work Force | 6,518 | 41,619 | 97,649 | |
Not In Work Force | 2,440 | 16,371 | 43,466 | |
Workforce Employed | 6,318 | 39,384 | 90,616 | |
Workforce Unemployed | 200 | 1,920 | 6,678 | |
Civlian Workforce | 6,518 | 41,304 | 97,294 | |
Military Workforce | 0 | 315 | 355 | |
Total Households | 4,666 | 26,943 | 61,821 | |
Family Households | 2,841 | 20,234 | 46,848 | |
Non-Family Households | 1,826 | 6,709 | 14,973 | |
Married Couple | 2,526 | 16,334 | 33,511 | |
Other Family | 315 | 3,900 | 13,336 | |
Married w/Child | 1,331 | 9,602 | 17,957 | |
Single Male w/Child | 1 | 252 | 1,308 | |
Single Female w/Child | 115 | 2,078 | 5,363 |
Population Change Last Two Decades - Plus Projection
2000 | % | 2010 | % | 2020 | % | 2030 | |
---|---|---|---|---|---|---|---|
Texas | 20,851,820 | +21 | 25,145,561 | +18 | 29,677,668 | +18 | 34,894,452 |
Fort Bend County | 354,452 | +65 | 585,375 | +44 | 840,383 | +43 | 1,203,029 |
Harris County | 3,400,578 | +20 | 4,092,459 | +22 | 4,978,845 | +19 | 5,924,750 |
Brazoria County | 241,767 | +30 | 313,166 | +20 | 375,869 | +20 | 452,517 |
Total Working Age Population:
Total Households:
Total Working Age Population:
Total Households:
Total Working Age Population:
Total Households: