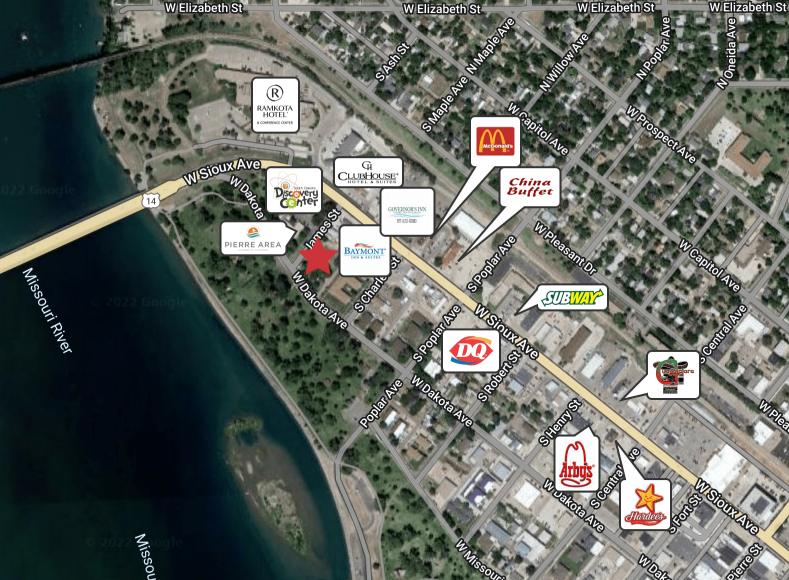
Commercial Land
James St Pierre, SD 57501
James St Pierre, SD 57501
Details & Description
Property Highlights
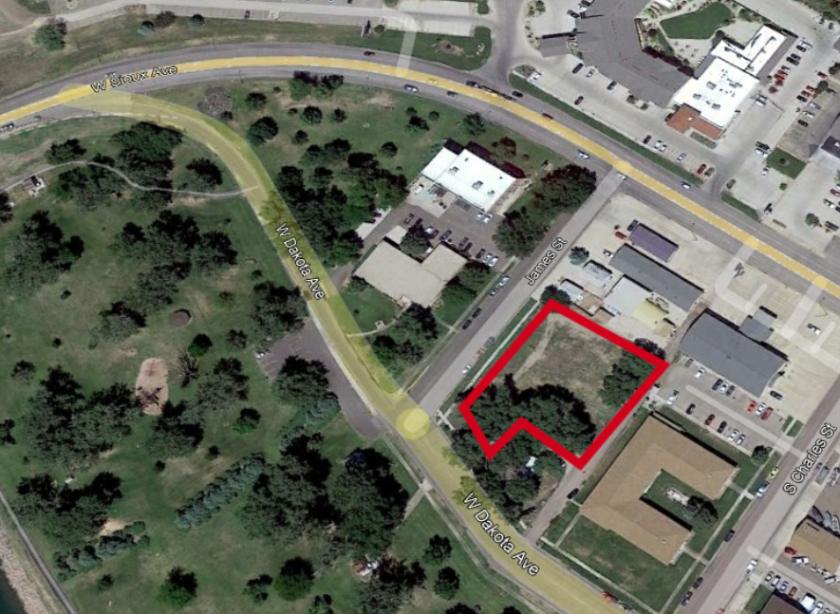
- • Lot size: 24,870 sq. ft.
- • Zoning: Commercial
- • 9 lots in total on parcel
Listing Agents

Dale Zomer
O: 605-444-7117
M: 605-351-1218
dzomer@naisiouxfalls.com
O: 605-444-7117
M: 605-351-1218
dzomer@naisiouxfalls.com
While we strive to provide the most accurate information, all listing information, and demographic data, is provided by third-parties. As such, MyEListing will not be responsible for the accuracy of the information. It is strongly recommended that you verify all information with the listing agent, and any relevant agencies, prior to making any decisions.