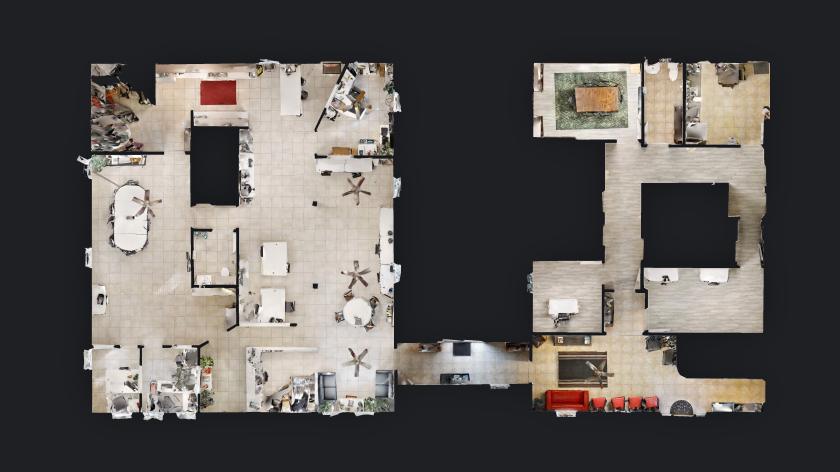
Office Space
22210 and 22206 Highland Knolls Drive Katy, TX 77450
22210 and 22206 Highland Knolls Drive Katy, TX 77450

Details & Description
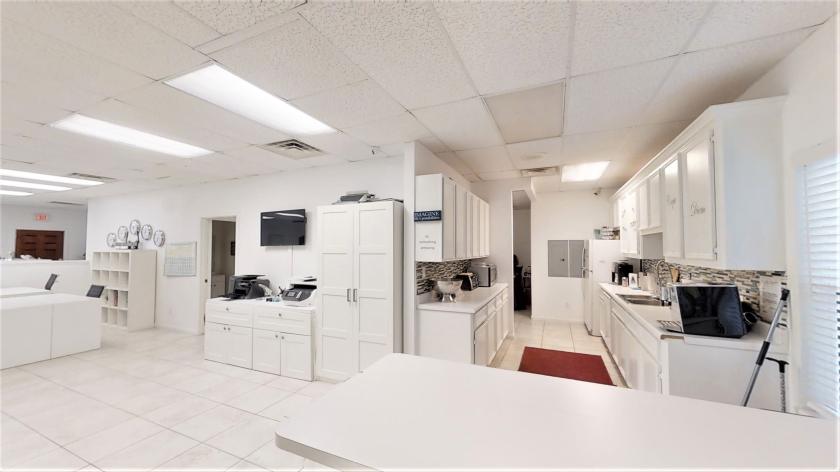
Additional Photos


Listing Agents

Vickey Wachtel
O: 832-728-2363
M: 281-728-1221
vickeywachtel@gmail.com
O: 832-728-2363
M: 281-728-1221
vickeywachtel@gmail.com
While we strive to provide the most accurate information, all listing information, and demographic data, is provided by third-parties. As such, MyEListing will not be responsible for the accuracy of the information. It is strongly recommended that you verify all information with the listing agent, and any relevant agencies, prior to making any decisions.