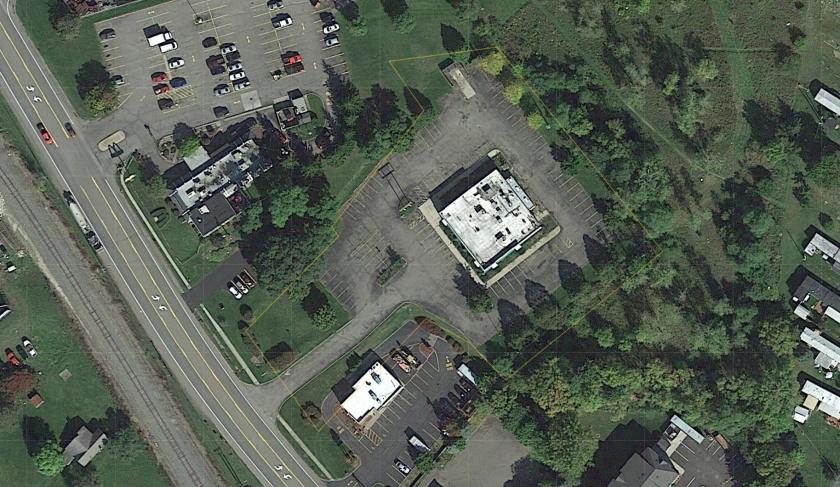
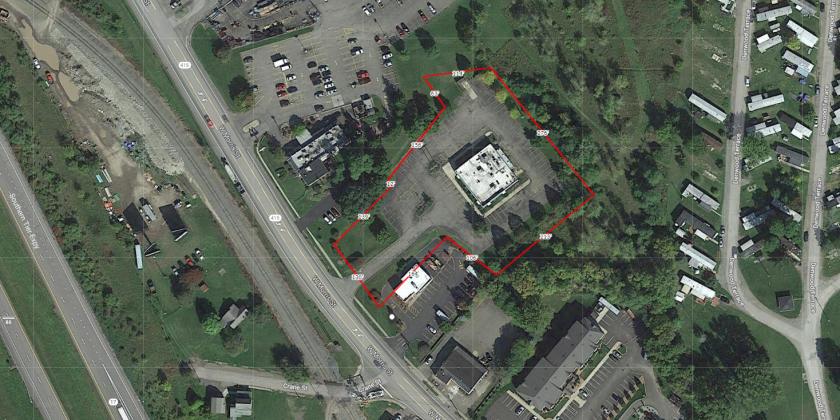
1-Mile | 3-Miles | 5-Miles | ||
---|---|---|---|---|
Total Population | 1,754 | 7,281 | 10,546 | |
Population Median Age | 42 | 45 | 46 | |
Population by Age | 0-9 Yrs | 189 (10%) | 755 (10%) | 989 (9%) |
10-19 Yrs | 223 (12%) | 662 (9%) | 1049 (9%) | |
20-29 Yrs | 95 (5%) | 815 (11%) | 1118 (10%) | |
30-39 Yrs | 176 (10%) | 646 (8%) | 1009 (9%) | |
40-49 Yrs | 349 (19%) | 879 (12%) | 1265 (11%) | |
50-59 Yrs | 288 (16%) | 844 (11%) | 1256 (11%) | |
60-69 Yrs | 297 (16%) | 1479 (20%) | 2090 (19%) | |
70+ Yrs | 137 (7%) | 1201 (16%) | 1770 (16%) | |
Median HH Income | $42,852 | $40,045 | $41,110 | |
Total Household Income | < 24K | 233 (29%) | 1000 (28%) | 1284 (26%) |
25-49K | 225 (28%) | 1133 (32%) | 1578 (32%) | |
50-74K | 110 (13%) | 586 (16%) | 858 (17%) | |
75-99K | 68 (8%) | 257 (7%) | 395 (8%) | |
100-199K | 138 (17%) | 490 (14%) | 673 (13%) | |
200K+ | 10 (1%) | 21 (0%) | 37 (0%) | |
Highest Education Level | No Diploma | 158 | 615 | 967 |
Diploma or GED | 655 | 2254 | 3331 | |
Some College | 221 | 887 | 1263 | |
Assoc. Degree | 76 | 784 | 1154 | |
Bachelors Degree | 91 | 415 | 585 | |
Higher Degree | 119 | 570 | 718 | |
Total Housing Units | 911 | 3,959 | 5,575 | |
--Owner-Occupied | 467 | 2,084 | 3,121 | |
--Renter-Occupied | 318 | 1,404 | 1,704 | |
Owner-Occupied Values | < 100K | 311 | 1228 | 1764 |
100-199K | 151 | 709 | 1040 | |
200-299K | 5 | 146 | 296 | |
300-399K | 0 | 0 | 6 | |
400-499K | 0 | 1 | 9 | |
500K+ | 0 | 0 | 5 | |
Total Working Age Population | 1,409 | 6,089 | 8,878 | |
In Work Force | 818 | 3,104 | 4,394 | |
Not In Work Force | 592 | 2,984 | 4,484 | |
Workforce Employed | 799 | 2,943 | 4,133 | |
Workforce Unemployed | 19 | 161 | 261 | |
Civlian Workforce | 818 | 3,104 | 4,394 | |
Military Workforce | 0 | 0 | 0 | |
Total Households | 786 | 3,488 | 4,824 | |
Family Households | 370 | 1,747 | 2,546 | |
Non-Family Households | 416 | 1,741 | 2,278 | |
Married Couple | 250 | 1,291 | 1,934 | |
Other Family | 119 | 456 | 612 | |
Married w/Child | 88 | 306 | 477 | |
Single Male w/Child | 7 | 151 | 197 | |
Single Female w/Child | 32 | 119 | 164 |
Population Change Last Two Decades - Plus Projection
2000 | % | 2010 | % | 2020 | % | 2030 | |
---|---|---|---|---|---|---|---|
New York | 18,976,457 | +2 | 19,378,102 | +4 | 20,146,131 | +2 | 20,604,030 |
Steuben County | 98,726 | 0 | 98,990 | -4 | 95,343 | -4 | 91,632 |
Total Working Age Population:
Total Households:
Total Working Age Population:
Total Households:
Total Working Age Population:
Total Households: