Industrial Properties
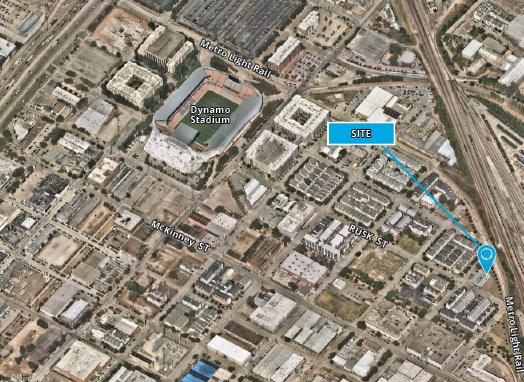
2905 Rusk Street Houston, TX 77003
2905 Rusk Street Houston, TX 77003
Details & Description
Property Highlights
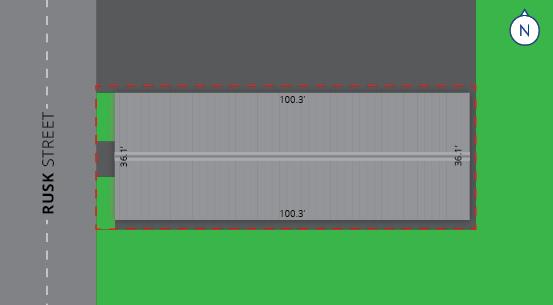
- • Office - Warehouse - 100% HVAC
- • Ceilling Height - 17' at Peak
- • 2 Grade Level Doors
- • Street Parking
Additional Photos

Listing Agents

Judy Garza Beebe
Colliers
O: 713-830-2168
M: 832-661-9232
judy.beebe@colliers.com
Colliers
O: 713-830-2168
M: 832-661-9232
judy.beebe@colliers.com
While we strive to provide the most accurate information, all listing information, and demographic data, is provided by third-parties. As such, MyEListing will not be responsible for the accuracy of the information. It is strongly recommended that you verify all information with the listing agent, and any relevant agencies, prior to making any decisions.


